
Utilizing Alkaline Hydrolysis to Recover Terephthalic Acid Monomer From PET-Based Textile Waste
Abstract
Over 85% of textile waste in the U.S. ends up in landfills, primarily because most textiles are difficult to recycle in an economically feasible manner if they consist of a blend of natural and synthetic fibers (United States Environmental Protection Agency, 2018). Mechanically separating natural and synthetic fibers is a labor-intensive and inefficient process. However, alkaline hydrolysis is a prospective method to chemically recycle blended textiles by recovering the monomer terephthalic acid (TPA) from fibers of its polymer, polyethylene terephthalate (PET). Applied industrially, this process could contribute to a circular economy by recycling textile waste into virgin-quality PET.
Alkaline hydrolysis was performed on 9 textiles varying in color, density, and composition, each containing between 25% and 84% polyester blended with a variety of other fibers. 2 control samples composed of 100% cotton and 100% polyester were hydrolyzed as well. In each case, the yield of TPA from hydrolysis was measured using three experimental approaches with the goal of determining whether any one of the methods might lead to error when assessing TPA recovery. The mass of the TPA was determined from each sample by stoichiometrically calculating the expected yield, performing UV-Visible spectrophotometry, and weighing the solid TPA that precipitated after acidification. All 9 textiles produced solid TPA flakes in yields exceeding 60% and as high as 96%. Analysis of the recovered TPA via infrared spectroscopy presented strong evidence that it was identical to lab-grade TPA. Further research into alkaline hydrolysis will be needed to determine which properties of a textile affect its TPA yield, develop methods of optimizing the hydrolysis process for different types of textiles, and polymerize the recovered TPA into PET.
Background
Each year, the US throws out over 34 billion pounds of textiles United States Environmental Protection Agency, 2018. Of these discarded textiles, at most 15% are recycled, but many of these “recycled” textiles are simply shipped abroad to international landfills United States Environmental Protection Agency, 2018. Textiles are rarely recycled due to the inefficiency with which the fibers can be separated; a single scrap of fabric often contains multiple types of fibers blended together. For instance, fabric in a sweatshirt could be made of 75% cotton and 25% polyester, and fabric to make athletic wear could be a proprietary mixture of synthetic fibers Ng, 2022. In order to recycle these fabrics, the fibers that make up the textile must be separated, which is extremely difficult due to their microscopic scale Bianchi et al., 2023.
Polyethylene terephthalate (PET), commonly known as polyester, is a highly recyclable plastic commonly used for food packaging and other consumer products. The monomers of PET, terephthalic acid (TPA) and ethylene glycol, can be obtained via alkaline hydrolysis, a type of chemical recycling. Rather than trying to mechanically separate polyester fibers from other materials, chemical recycling can employ many types of chemical reactions to isolate raw materials more efficiently. Of the 3 types of hydrolysis (acid hydrolysis, alkaline hydrolysis, and neutral hydrolysis), alkaline hydrolysis was chosen for this study because it can occur under mild reaction conditions and does not require specialized equipment or chemicals Abedsoltan, 2023.
The alkaline hydrolysis reaction (Figure 1) involves heating PET with aqueous sodium hydroxide, which cleaves the PET chain along the ester bond and produces disodium terephthalate and ethylene glycol. Adding sulfuric acid to these products will trigger a precipitation reaction that produces solid terephthalic acid and aqueous sodium sulfate. Bengtsson et al. (2022) utilized alkaline hydrolysis to break down PET in the 100% polyester fabric tricot while investigating which fabric preparation methods would produce the highest yields of TPA. They converted nearly 100% of PET in the sample into TPA and dissolved all of the fabric in the process, leaving behind no solid waste in trials hydrolyzed for 24 hours Bengtsson et al., 2022. Bengtsson et al.’s research established a method for performing alkaline hydrolysis on textiles and assessing the products that this research builds on.
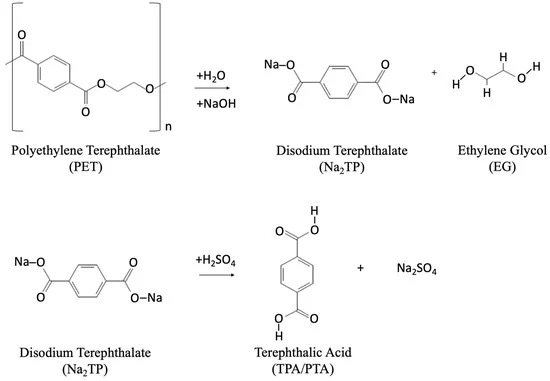
Figure 1:Alkaline Hydrolysis and Acidification Reactions to Yield TPA from PET Benyathiar et al., 2022
This study explores whether alkaline hydrolysis could break down blended textiles and generate high yields of TPA. Additionally, the TPA was assessed qualitatively to determine its applicability to be reintroduced in the manufacturing process. If alkaline hydrolysis can efficiently recycle blended textiles on an industrial scale, it would eliminate the need to identify and sort fabric samples by composition. Consequently, textile recycling could generate “virgin-quality” TPA used to manufacture new products, in a closed-loop manufacturing system instead of relying on petroleum and natural gas to create more plastics destined for the landfill Bardoquillo et al., 2023.
Materials and Methods
9 blended fabric samples of varying compositions, colors, and densities were provided by Hanesbrands Inc. Control samples of 100% cotton and 100% polyester were purchased at Walmart. Table 1 shows a summary of the textiles in order of increasing polyester content.
Table 1:Summary of Textiles Used for Hydrolysis
| Sample | % Polyester | % Cotton | % Elastane | % Rayon | Density (GSM) | Color | Vendor |
|---|---|---|---|---|---|---|---|
| 1 | 0 | 100 | 0 | 0 | 141 | White | Walmart |
| 2 | 25 | 75 | 0 | 0 | 430 | “Ash Heather” | Liztex |
| 3 | 26 | 70 | 4 | 0 | 155 | Navy Blue | Best Pacific |
| 4 | 26 | 70 | 4 | 0 | 185 | White | Best Pacific |
| 5 | 48 | 48 | 4 | 0 | 280 | “Utility Brown” | Liztex |
| 6 | 48 | 48 | 4 | 0 | 390 | “Utility Brown” | Liztex |
| 7 | 50 | 50 | 0 | 0 | 210 | “Utility Brown” | Liztex |
| 8 | 50 | 50 | 0 | 0 | 300 | “Utility Brown” | Liztex |
| 9 | 78 | 0 | 22 | 0 | 245 | Black | TexRay |
| 10 | 84 | 0 | 4 | 12 | 160 | Black | Best Pacific |
| 11 | 100 | 0 | 0 | 0 | 106 | White | Walmart |
Guided by the Swedish Institute for Standards’ proprietary instructions, all textile samples were washed together on warm in a laundromat-style front-loading washing machine and tumble dried on high in a front-loading dryer. Afterwards, all samples were cut into 1 cm squares. Immediately before hydrolysis, each sample was oven dried for at least 105 minutes to remove moisture.
The alkaline hydrolysis reaction was carried out in a standard reflux setup Figure 2. A 500 mL single neck round bottom flask connected to a condenser column was used as the reaction vessel. The flask was suspended in an oil bath over a stirring hotplate to heat the reaction evenly, with a thermometer in the oil to monitor the temperature.
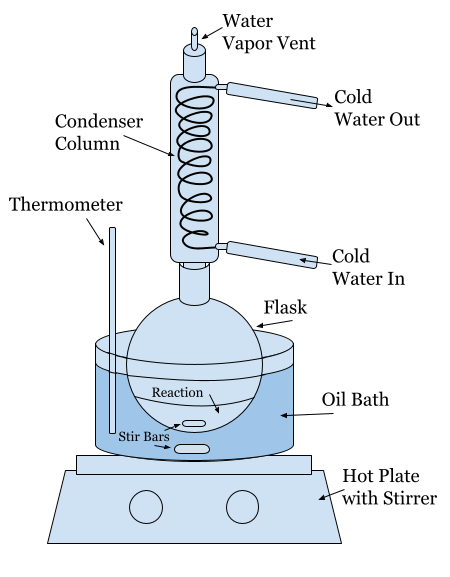
Figure 2:Hydrolysis Reaction Setup
In the flask , 250 mL of 5% NaOH solution was heated to approximately 90°C. Then, 2.50 g of dried textile was added to the solution. The temperature and stirring rate were maintained for 18 hours, after which the hot plate was turned off and the flask was raised out of the oil to cool. Any remaining solids were separated using vacuum filtration with a Buchner funnel and Whatman 1 filter paper. Both the filtrate and the retentate were retained for analysis. Three methods were used to calculate the TPA yield from each sample.
Stoichiometric Yield
The first way TPA yield was calculated was by determining the mass change of the sample before and after hydrolysis. The remaining textile in the flask was first neutralized in 2M acetic acid, using phenolphthalein as a pH indicator. Then, the sample was dried in the oven at 105°C until no mass change was detected. Once the sample was dry, its mass was used to calculate the mass of the TPA recovered.
Absorbance Yield
To find the yield of TPA from the post-hydrolysis filtrate, a Thermo Scientific Evolution Pro UV-Vis spectrophotometer was used to find the absorbance of the sample at 242 nm Bengtsson et al., 2022. First, a standard curve was created using 7 concentrations of TPA dissolved in 5% NaOH, diluted in water 1600 times Figure 3. After each hydrolysis reaction, 100 μL of post-hydrolysis filtrate was added to 160 mL of water to create a 1:1600 dilution. Then the absorbance value was found via UV-Vis spectrophotometry and mapped to the standard curve to find the concentration of TPA dissolved in the reaction solution Figure 3.
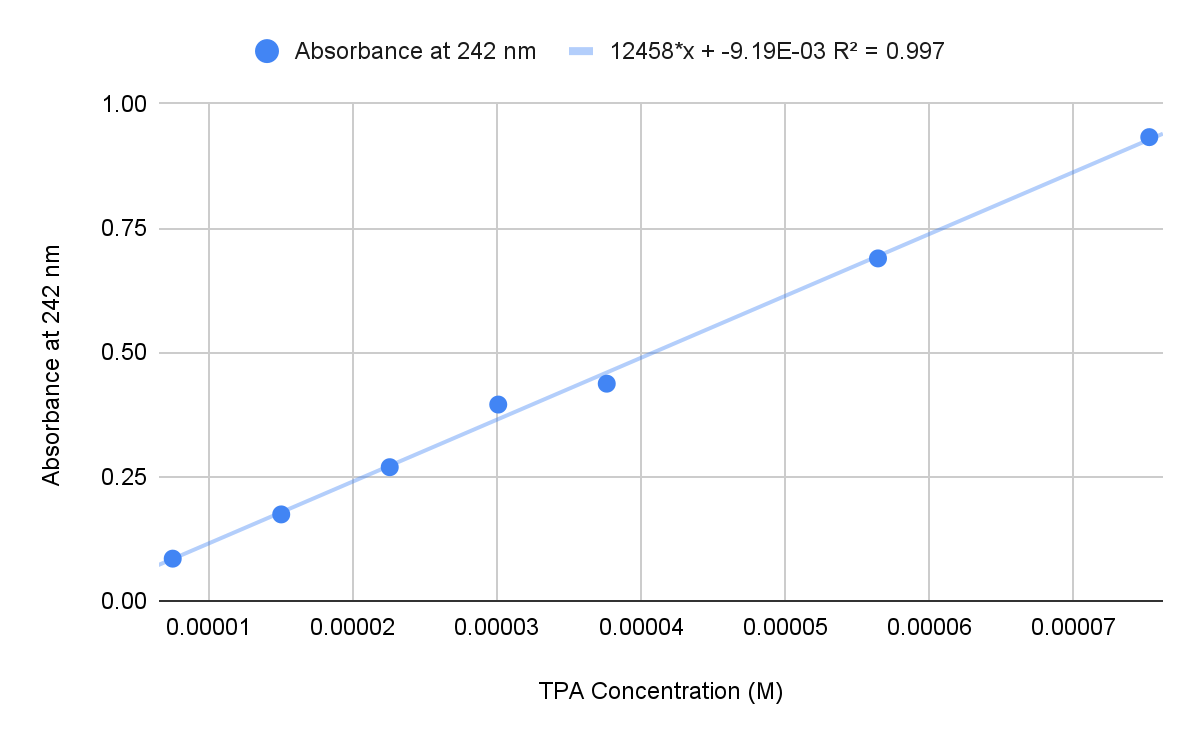
Figure 3:TPA Absorbance Standard Curve at 242 nm
Gravimetric Yield
The gravimetric yield of solid TPA was determined by acidifying the reaction solution. 18M H2SO4 was added to the filtrate until the pH reached roughly 2.5 and TPA formed as a precipitate. The resulting mixture was allowed to sit until the TPA settled to the bottom. As much of the aqueous layer as possible was decanted and vacuum filtered in a Buchner funnel using Whatman 1 filter paper. The remaining mixture was centrifuged for 10 minutes at 6000 rpm. The new aqueous layer was decanted and vacuum filtered to separate any TPA particles. Excess liquid retained in the TPA was drawn out using vacuum filtration. Afterwards, the TPA and filter papers were dried in the oven at 105°C for at least 2 hours. Once dry, all TPA was scraped off of the filter paper and massed.
The purity of the solid TPA recovered was assessed using FTIR spectroscopy. Ten KBr samples made with recovered TPA from each of 9 hydrolyses and an additional control sample with lab grade TPA were prepared in a 1:1000 ratio of TPA to potassium bromide. These samples were then analyzed using a Shimadzu IRSpirit FTIR spectrophotometer.
Results and Discussion
The TPA recovered from each trial had few to no impurities revealed by FTIR spectroscopy. An FTIR spectrum was collected from each sample and compared to a spectrum collected from lab-grade TPA (Thermo Scientific 99+%). Figure 4 shows the FTIR spectrum of TPA from sample 6 (Table 1) overlaid onto the lab-grade TPA spectrum. For every trial, each peak on the synthesized TPA spectrum corresponded to a peak found on the control TPA spectrum at the same wave number. Any impurities, which would have likely caused extraneous peaks, did not appear to be present, indicating that the TPA recovered from the samples did not contain any contaminants.
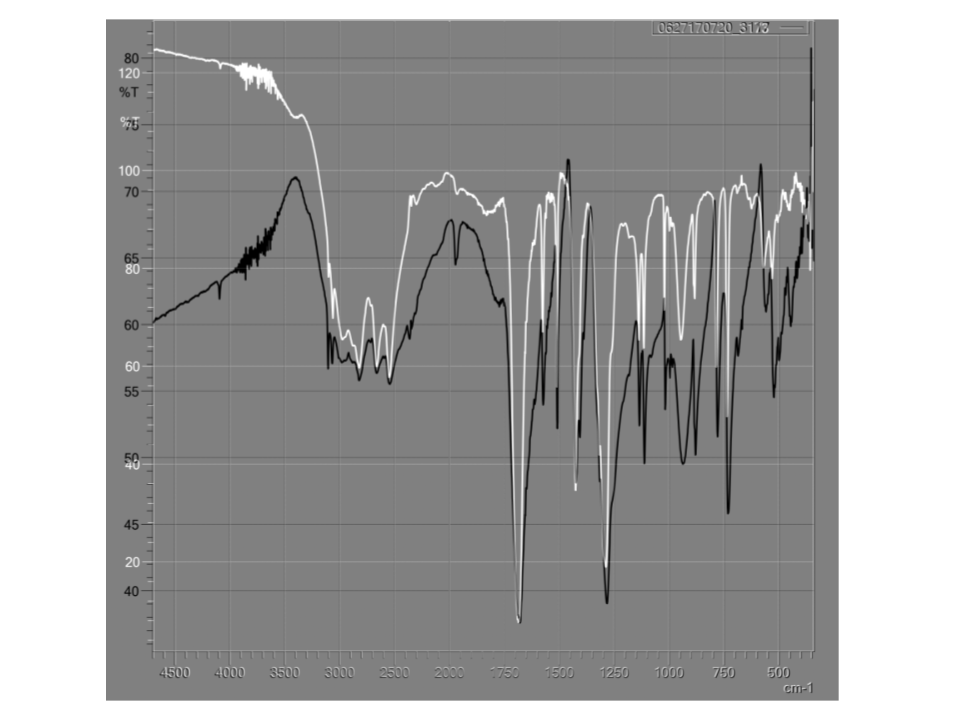
Figure 4:Overlaid FTIR Spectra of TPA Recovered from Textile Sample 6 and Lab-Grade TPA
Each of the 3 methods for finding the yield of TPA from a textile sample were plotted together in order of increasing polyester content Figure 5. Overall, there is a direct relationship between the amount of polyester in a sample and the mass of TPA extracted from that sample. The blue circles represent the yield of TPA by subtracting the mass of the solid waste after hydrolysis from the mass of the initial textile sample and calculating the stoichiometric mass of TPA recovered:
= grams of TPA
For nearly every sample with a polyester content less than or equal to 50%, this metric of measuring TPA yield was practically identical to the other two, indicating that all 3 methods of finding TPA yield are equally accurate. In the case of the 100% cotton sample, not all fibers could be recovered after hydrolysis, as some remained suspended in the aqueous product or stuck to the filter paper. This accounts for a higher than expected mass loss and subsequent higher calculated TPA mass.
The red squares Figure 5 represent the TPA yield calculated from running the aqueous hydrolysis product in the UV-Visible spectrophotometer. After obtaining the concentration of TPA in sodium hydroxide using the standard curve Figure 3, the following conversion was used to obtain the mass of TPA in the original 250 mL reaction:
= grams TPA
The yellow triangles Figure 5 represent the yield of TPA obtained via precipitation out of the reaction solution. With the exception of samples 10 and 11 (Table 1), the gravimetric mass of TPA matched the absorbance mass of TPA.
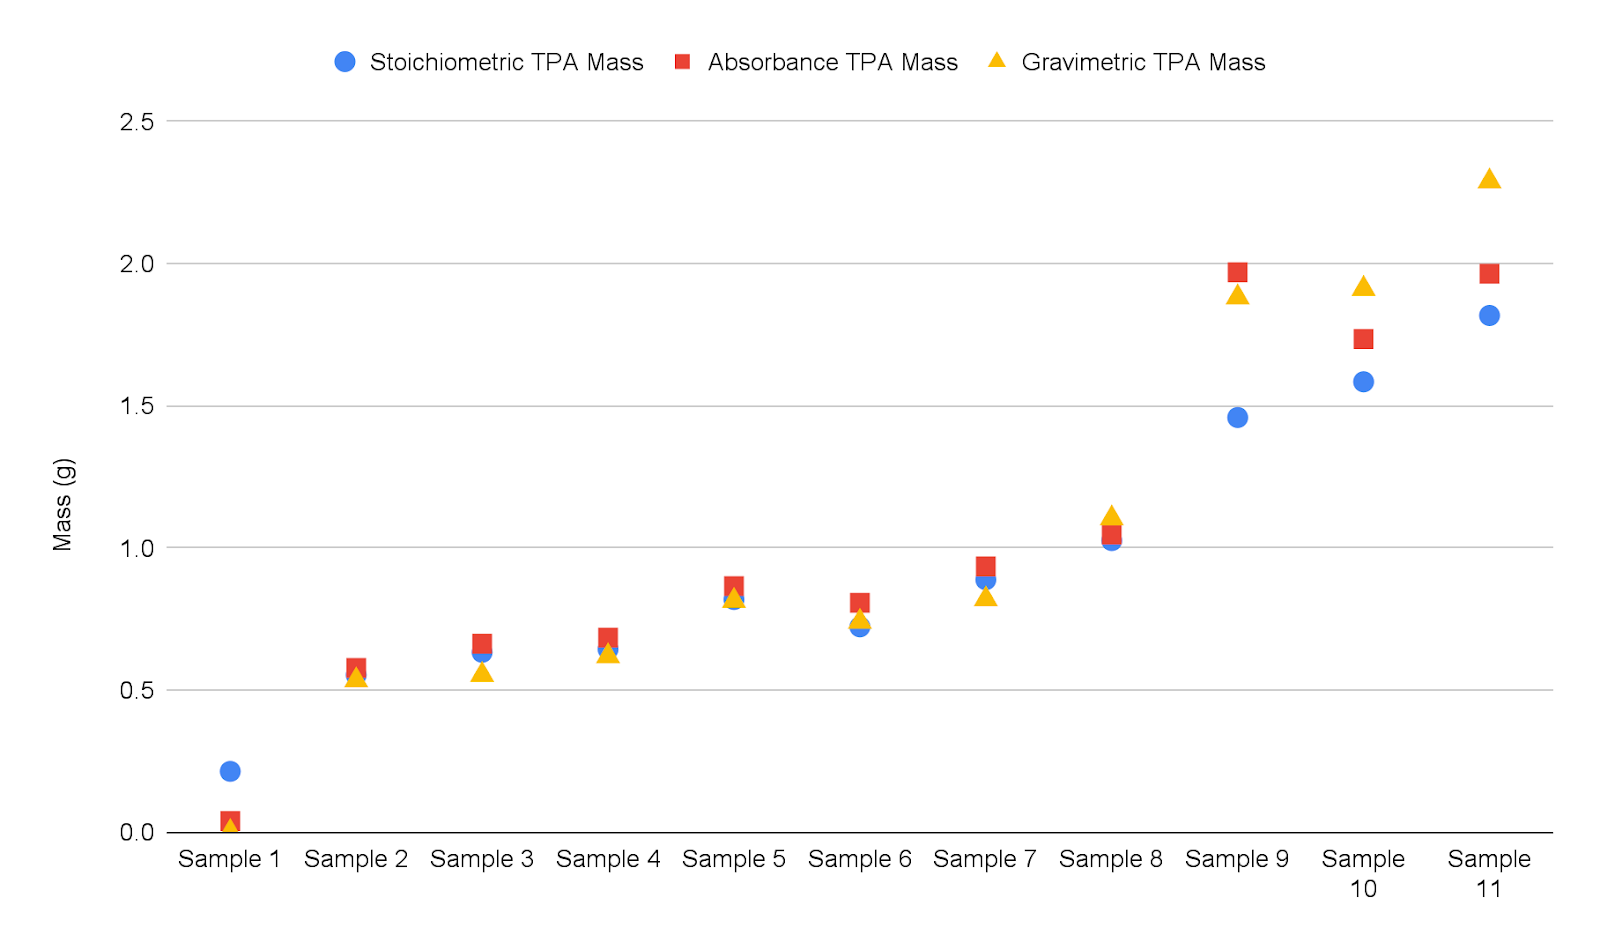
Figure 5:Three Methods for Collecting TPA Yields Per Sample
3 pairs of samples contained the same composition of fibers, either differing in fabric density, type of knit, or color Figure 6. According to the labels provided by Hanesbrands, the only difference between the samples 5 and 6 (Table 1) was the fabric density listed. According to [bengtsson_chemical_2022], textiles with a greater “accessible area” for hydrolysis, such as textiles with a lower density, fibers that have been texturized to improve breathability, or samples that are finely cut or shredded, are more responsive to alkaline hydrolysis. This statement is consistent with samples 5 and 6, where the medium weight textile demonstrated a higher TPA yield than the heavy weight sample Figure 6.
Samples 7 and 8 (Table 1) were constructed using different knits, with sample 7 made of a lower density jersey knit and sample 8 made of a higher density fleece knit Figure 6. Contrary to the findings of Bengtsson et al. (2022), sample 8 had a higher yield, indicating the knit or weave of a sample may affect its TPA yield more than a sample’s density. However, since the density was not controlled for, a definite conclusion cannot be reached.
Samples 3 and 4 had comparable densities but were different colors. The yields of TPA for each sample were similar, indicating that different dyes used did not affect the yield Figure 6.

Figure 6:Comparison of TPA Yields of Textiles With Identical Composition
The theoretical mass of TPA obtained from hydrolysis was found by multiplying the initial mass of the sample by the percentage of polyester in the sample. Some samples included multiple types of polyester such as “recycled polyester” or “bulk polyester” listed separately. For this purpose, all types of polyester were combined into a single percentage. A total experimental yield of TPA for each sample was found by averaging the three methods for collecting TPA yield Figure 7. While the theoretical TPA mass was proportional to the amount of polyester in the sample, the experimental mass was not, indicating that some properties of the textile affected the TPA.
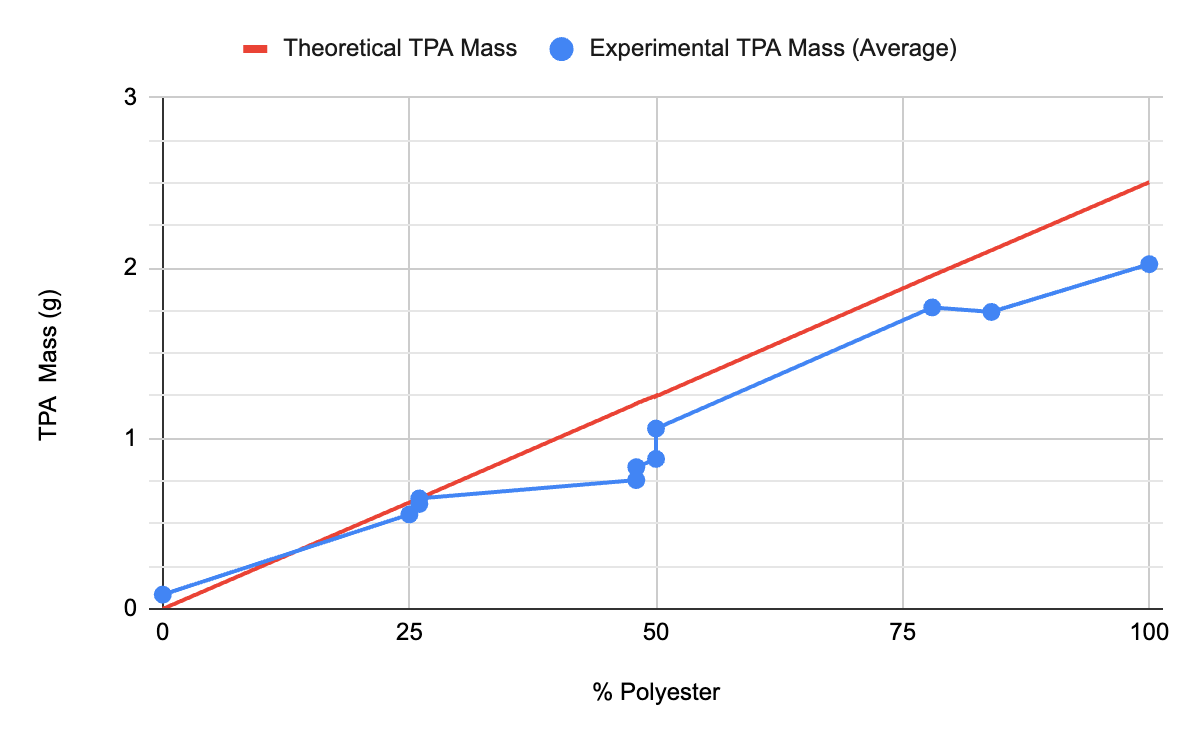
Figure 7:Theoretical vs Experimental Yields of TPA Per Sample
The percent yield from each sample containing polyester was visualized in 2 ways: with data organized by increasing sample density Figure 8 and by increasing percent polyester Figure 7. Percent yield of TPA was calculated by dividing the average experimental TPA yield by the theoretical TPA yield and multiplying by 100. Every sample had a yield of TPA over 60%, but neither the percent composition of polyester nor the fabric density correlated with the percent yield. Bengtsson, et al. (2022) indicated that higher density textiles may hinder TPA yields because alkaline hydrolysis proceeds from the ends of the polymer, but this trend was not detected. Additionally, the amount of polyester in the textile had no bearing on TPA yields, indicating that the reaction doesn’t cease after a certain amount of PET has been hydrolyzed. Additional experimentation separately controlling for variables such as fiber composition, color, and density would need to be performed to determine which factors affect a fabric’s percent TPA yield.
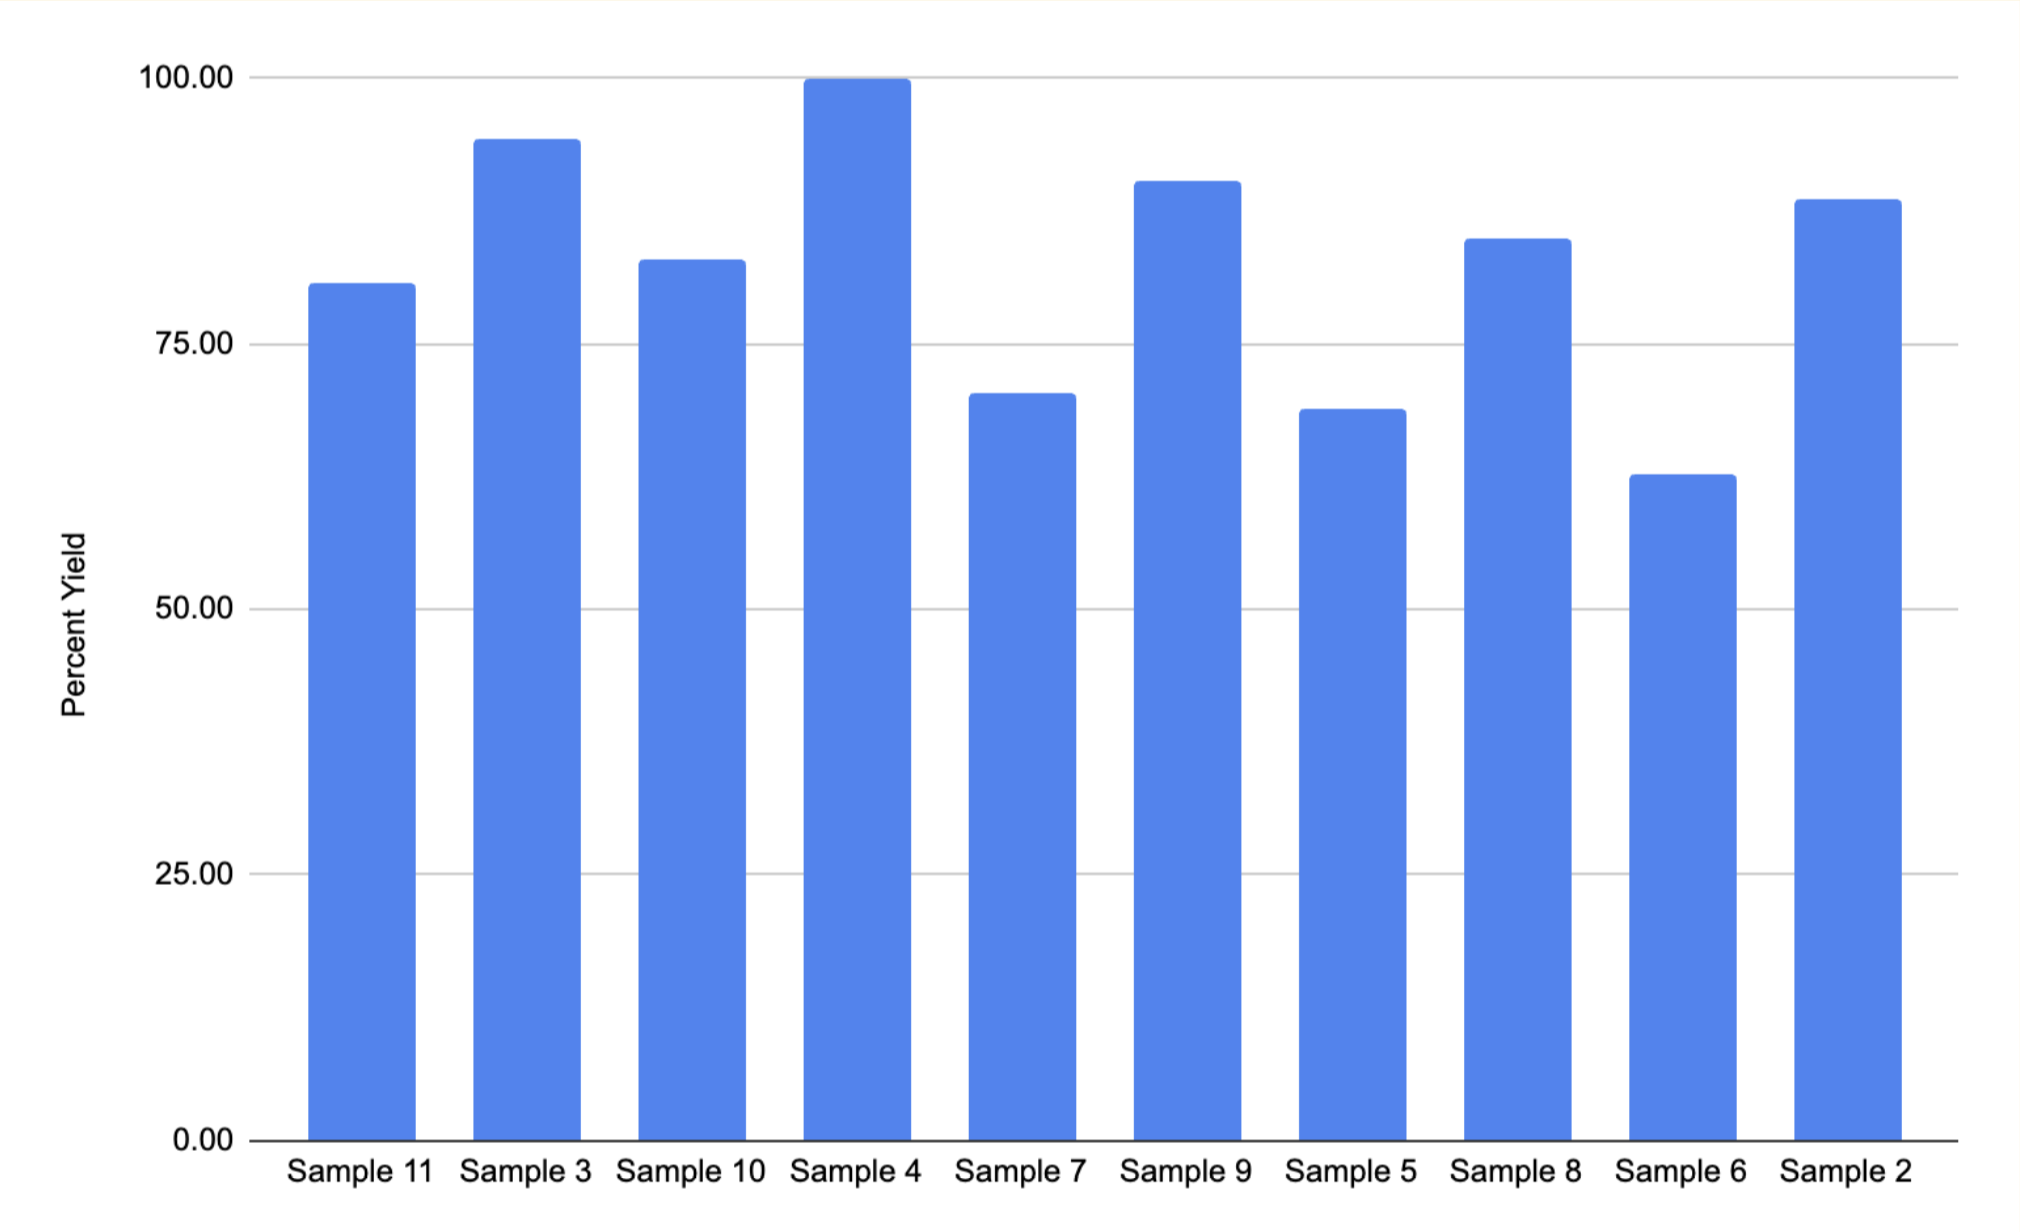
Figure 8:Percent Yield of TPA Per Sample Organized by Increasing Sample Density
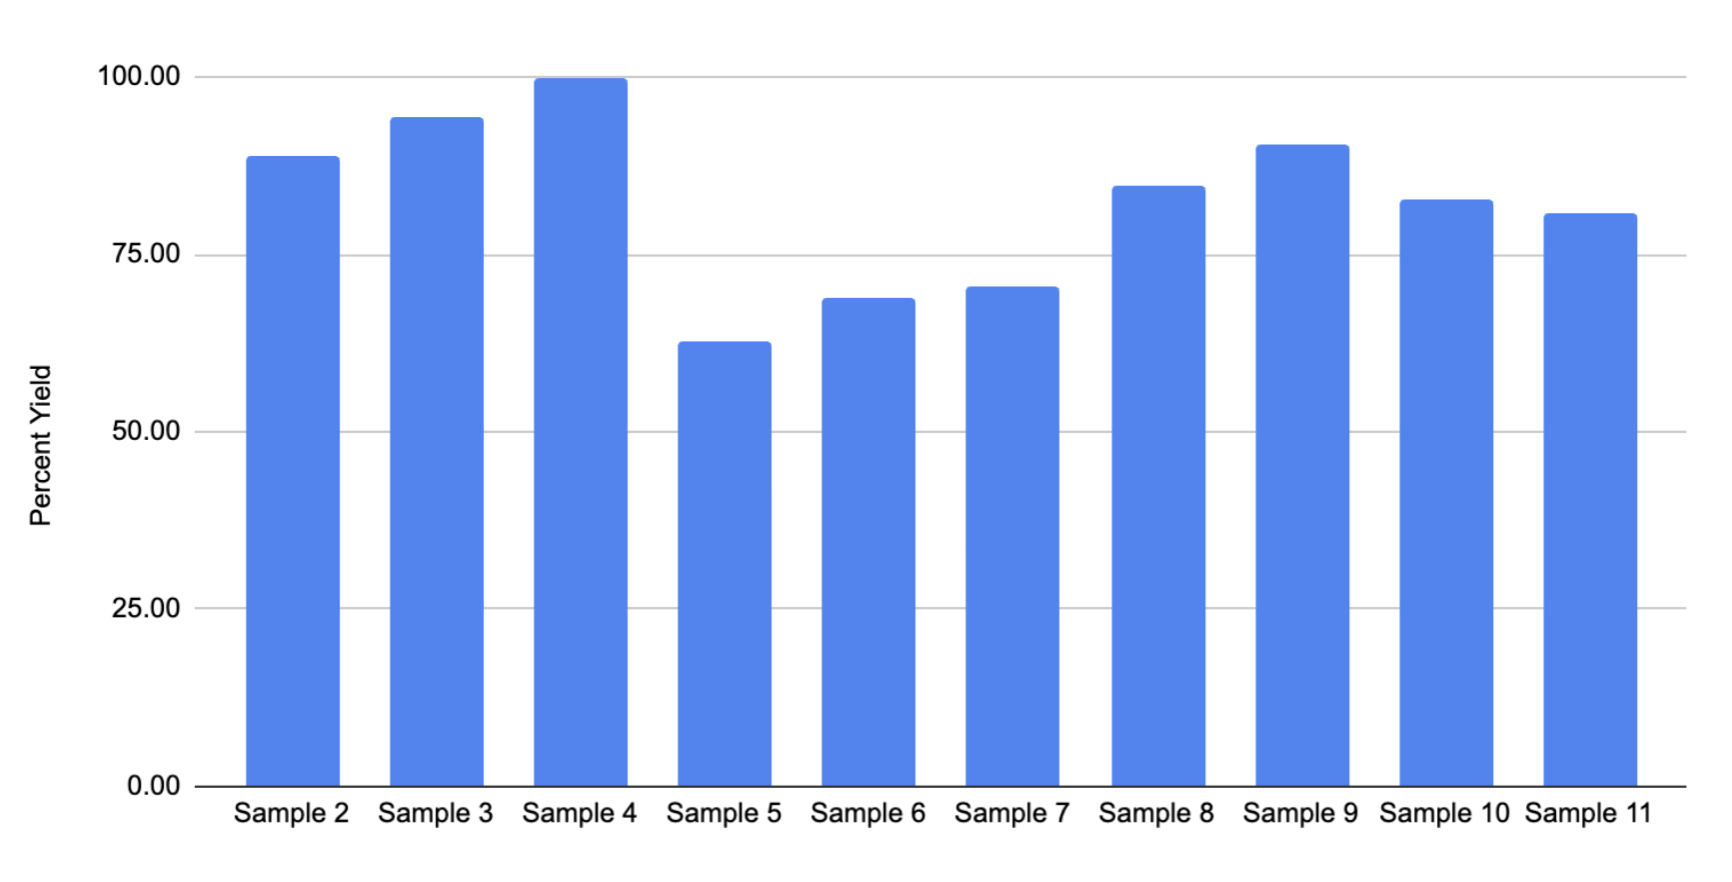
Figure 9:Percent Yield of TPA Per Sample Organized by Increasing Polyester Content
Conclusions
High quality TPA was successfully recovered via alkaline hydrolysis from every blended textile sample tested, indicating alkaline hydrolysis could be a type of chemical recycling utilized commercially and applied to the closed-loop manufacturing model. The TPA recovered from all samples contained few to no impurities as revealed by FTIR spectroscopy, although the color of the recovered TPA varied slightly depending on the color of the fabric sample hydrolyzed. Of the three ways that TPA yield was estimated, TPA yields based on UV-Visible spectrophotometry provided accurate yield estimates and proved to be an efficient method for estimating the yield of TPA in a sample before it was precipitated. In future experimentation, finding the TPA yield via absorbance could be used alone to estimate the yield of TPA from hydrolysis. All 9 samples produced an average TPA yield over 60% of the theoretical yield, but identifying which characteristics of a fabric sample affect TPA yield as well as modifying the hydrolysis process to optimize TPA yield for any given sample are areas of further study. Moreover, testing whether the produced TPA can be polymerized into usable PET is a crucial next step to determining whether alkaline hydrolysis is a feasible and effective method for recycling blended textiles on an industrial scale.
The North Carolina School of Science and Mathematics is acknowledged for providing funding, equipment, and lab space to complete this research. Furthermore, Dr. Tandy Grubbs is acknowledged for his mentorship and guidance during this project.
Copyright © 2024 Kitchell. This is an open-access article distributed under the terms of the Creative Commons Attribution 4.0 International license, which enables reusers to distribute, remix, adapt, and build upon the material in any medium or format, so long as attribution is given to the creator.
- PET
- Polyethylene terephthalate
- TPA
- Terephthalic acid
- United States Environmental Protection Agency. (2018). Textiles: Material-Specific Data. https://www.epa.gov/facts-and-figures-about-materials-waste-and-recycling/textiles-material-specific-data
- Ng, W. (2022). Proprietary Weaving Technology and Fabric Material Meant That Clothing Companies Are Monopolistic in Their Individual Market Segment. https://ssrn.com/abstract=4266519
- Bianchi, S., Bartoli, F., Bruni, C., Fernandez-Avila, C., Rodriguez-Turienzo, L., Mellado-Carretero, J., Spinelli, D., & Coltelli, M.-B. (2023). Opportunities and Limitations in Recycling Fossil Polymers from Textiles. Macromol, 3(2), 120–148. 10.3390/macromol3020009
- Abedsoltan, H. (2023). A focused review on recycling and hydrolysis techniques of polyethylene terephthalate. Polymer Engineering & Science, 63(9), 2651–2674. 10.1002/pen.26406
- Bengtsson, J., Peterson, A., Idström, A., De La Motte, H., & Jedvert, K. (2022). Chemical Recycling of a Textile Blend from Polyester and Viscose, Part II: Mechanism and Reactivity during Alkaline Hydrolysis of Textile Polyester. Sustainability, 14(11), 6911. 10.3390/su14116911
- Benyathiar, P., Kumar, P., Carpenter, G., Brace, J., & Mishra, D. K. (2022). Polyethylene Terephthalate (PET) Bottle-to-Bottle Recycling for the Beverage Industry: A Review. Polymers, 14(12), 2366. 10.3390/polym14122366
- Bardoquillo, E. I. M., Firman, J. M. B., Montecastro, D. B., & Basilio, A. M. (2023). Chemical recycling of waste polyethylene terephthalate (PET) bottles via recovery and polymerization of terephthalic acid (TPA) and ethylene glycol (EG). Materials Today: Proceedings, S2214785323020564. 10.1016/j.matpr.2023.04.160
