Optimizing Photovoltaic Output Through the Integration of Passive Optical Tools for Enhanced Photon Capture in Solar Cells
Abstract
Solar panels utilize light energy from the sun through their solar cells to generate electricity. However, during nighttime or when the weather is disrupting the sun, they may not be as efficient in producing electricity because there is not enough energy to knock electrons from their bond and generate power. This experiment’s purpose was to increase the efficiency of solar panels through focusing and reflective materials. The hypothesis was tested by focusing light through a magnifying glass onto a solar panel, by using a mirror to reflect light towards another panel, and finally comparing those two to a control. These experiments occurred on a sunny day, cloudy day, and during sunset for 1 minute per trial with a total of 3 trials per sunlight condition. Vernier Graphical Analysis devices collected quantitative current & voltage measurements, which were then analyzed through comparative graphs created for the 3 different conditions listed. Due to the optical tools’ influence, the test panels showed a voltage and a current increase of up to 2.1%-14.6% during each scenario. The hypothesis was correct in the sense that these optical devices produced an increased amount of wattage during all 3 situations, giving a rise in solar efficiency. In conclusion, a wattage increase of up to 25% can be significant when using solar panels during times when solar panel usage is not optimal, essentially seeking to find a solution providing consistent energy with efficiency.
Introduction
As the demand for energy continues to grow, finding sustainable solutions has become one of the most pressing challenges in today’s world. While previous generations heavily relied on fossil fuels for their energy needs, the environmental costs make them unsustainable in the long run. Since the Industrial Revolution, our dependence on fossil fuels significantly grew, leading to an increase in carbon dioxide levels in Earth’s atmosphere. Over the last two centuries, has risen by 50%. Since 2002 itself, we have increased by 55 parts per million to 420 ppm, referring to molecules per 1 million molecules of dry air Bolles, 2025. Carbon dioxide being a greenhouse gas essentially traps the sun’s solar radiation within the atmosphere and causes surface temperatures to rise. While this greenhouse effect is a natural process critical for maintaining Earth’s habitable climate, anthropogenic activities since the 1800s have intensified it far beyond protective levels. This resulting global warming poses harmful threats to human health, wildlife, agriculture, and our environment as a whole Manisalidis et al., 2020.
Renewable energy offers a promising path forward. Unlike fossil fuels, they are abundant, clean, and naturally replenished in a small period of time, making them critical in the transition to sustainable energy systems. Hydroelectric and wind energy both use moving streams to spin a turbine and generate electricity, achieving renewability, but they aren’t consistent worldwide. Solar energy, unlike the others, has the ability to revolutionize global power generation. Throughout history, the sun has been a constant, powerful source of light and energy. Despite its potential, there’s still the challenge in efficiency and reliability, especially under variable conditions. Overcoming these challenges is essential to realizing its full promise as a leading energy source. By utilizing passive devices, meaning those that are not taking extra energy from outside, and enhancing that for energy capture and conversion, can significantly improve the performance of solar panels. This experiment integrates optical tools, specifically, magnifying glasses and mirrors to achieve this.
It is hypothesised that on sunny days, neither magnifying glasses nor mirrors can further optimize solar panel performance. This is because as photons strike the PV cells and dislodge electrons, fewer electrons remain available for displacement, limiting the impact of additional light. As a result, when more photons are reflected onto the solar panel through passive optical devices, the likelihood of dislodging more electrons decreases as fewer remain available to be displaced. Thus the wattage output of a standalone panel may closely match one using optical devices. However, on days when it is cloudy or during sunrise/sunset, it is predicted that flat mirrors and magnifying glasses could be utilized to increase a solar panel’s wattage output. This is hypothesized because when there are not many photons hitting the photovoltaic cells, the mirror will be able to direct additional photons that would have otherwise missed the solar panel back towards the panel, and similarly magnifying glasses would be able to concentrate more photons directly onto the solar panel. For that reason both optical tools would be able to create enough electron-hole pairs to increase the flow of electricity. Furthermore, it is predicted that a magnifying glass will be able to outperform a flat mirror in directing photons to the PV cell, resulting in higher wattage output. This is because flat mirrors reflect light at an angle equal to the angle of incidence so all of the light will not necessarily be reflected directly onto the solar panel. That would make the magnifying glass be more efficient, but these mirrors are still way better to use than a solar panel standing alone.
A big societal impact of this experiment is more frequent usage of solar panels and lesser use of fossil fuels for energy. Solar panels can also be set up easier than long energy lines when trying to provide energy to remote areas. Finally, in regions with limited sunlight, reflectors and concentrators can help achieve efficiency levels comparable to areas with abundant sunlight. Enhancing their performance could lower costs while improving their reliability and effectiveness as a renewable energy solution.
Background
Solar panels are used to harness the power of the sun, a renewable source of energy. These panels are made from silicon or a semiconductor which is installed between conductive layers. Silicon is an element where its atoms have 14 electrons, 4 of which are on the outermost shell. Since silicon tends to fill up that shell, it will share electrons with four nearby atoms, forming a crystalline structure. This is the exact kind of structure needed in photovoltaic cells. PV cells use 2 different layers of semiconductor material– an N type which has extra electrons and a P type which has extra spaces for electrons. When the two types of semiconductor meet, electrons can drift across the P/N junction, leaving a positive charge on the layer with the holes and a negative charge on the layer with excess electrons. The role of the sun is to release small particles called photons. If they can strike a solar cell with enough energy, it can knock electrons from their bond, leaving a hole. The negatively charged electron moves in one direction to fill the positively charged hole. Along the way, the moving electrons are collected by thin metal conductors which use them to generate electrical energy as they move on their path. The cell’s electric field generates voltage, driving electron flow to create current. The product of the two is wattage, or the power needed for electrical work. Once the electrons fill in the holes, they essentially go back to where they came from so this same process can be repeated for many years, hence, renewable energy Toothman & Aldous, 2015.
Of course, this is only if the photon strikes the solar cell with enough energy. This may not always be the case, such as cloudy days or when the sun isn’t up. By using magnifying glasses, the goal is to concentrate sunlight right on the solar panel. This explanation draws from the science behind the optics used in magnifying glasses. A magnifying lens is made of a mix of two different types of surfaces coming from either convex, concave, or flat. Lens’ also have focal points which is where all the light rays converge after passing through. With this attribute, magnifying glasses have the opportunity to concentrate sunlight to any desired location. As a result, more photons will be directed at a single point to knock electrons loose from their atoms, and overall, harness more energy. Similarly, the incorporation of mirrors allows the solar panel to maximize its photon absorption. By reflecting additional sunlight onto the panel’s surface, the mirrors enhance its ability to harness energy from both direct and reflected solar radiation Tobias et al., 2020.
On average, a solar cell can produce 0.5-0.6 volts. The main factors that can play a role in the power generated, which is the product of both current & voltage, is efficiency, surface area, and its proportionality to the intensity of light striking the solar cell. Under optimal sunlight conditions, a standard PV panel with a surface area of 160 cm2 can generate about 2 watts at 100% intensity. During days where this is not the case, wattage can drop significantly. Studies indicate that incorporating passive devices can substantially increase the efficiency and output of PV cells. Passive devices that would work in this situation include reflectors, cooling systems, solar tracking mounts, concentrators, etc. Without drawing the need of additional external energy, these mechanisms are valuable in optimizing solar cell performance Arshad et al., 2014.
Experiment
Project Materials
- AK52X52: 52mm x 52mm Solar Panels - 3
- Double Concave Magnifying Glass - 1
- Mirror - 1
- Vernier Graphical Analysis Voltage Probes - 3
- Vernier Light Sensor - 1
- Vernier LabQuest Mini Interface - 1
- 330 Ohm Resistors - 1
- Red LED Lights - 1
Methodology
- Find a outdoor spot around noon on a sunny day to set up to record data
- Place solar panels on a table (keep them flat) such that they are right in the sun
- Connect the positive end of the voltage probe to the positive wire of the solar panel and the negative end of the voltage probe to the negative wire of the solar panel
- Repeat step 3 for the other two solar panels
- Place the mirror behind one of the solar panels and angle it downwards so that the light rays fall in an ellipse surrounding the panel to the best of its ability
- Place magnifying glass in front of another panel so that it focuses the light onto it
- The solar panel should be viewable through the magnifying glass
- Connect all 3 voltage probes to the Vernier LabQuest Mini Interface
- Open Vernier’s Graphical Analysis software and set it up to collect data for 180 seconds at a rate of 20 samples per second
- Run the software to collect data for 180 seconds and save the data
- Take a 330 Ohm resistor and wrap one end of the resistor around the anode of an LED (the longer lead)
- Take one solar panel with the voltage probe and wrap the positive wire around the other end of the resistor
- Connect the negative wire from the solar to the other lead on the LED
- Take the light probe and place it to face the same direction as the solar panel
- Disconnect the voltage probe from the other two solar panels, and connect the voltage probe and the light sensor from this solar panel to the Vernier LabQuest Mini Interface
- Open Vernier’s Graphical Analysis software and set it up to collect data for 60 seconds at a rate of 20 samples per second
- Run the software to collect data for 60 seconds and save the data
- Repeat steps 16 & 17 two more times under the mirror & magnifying glass
- Repeat steps 16-18 two more times for a total of three trials under all three conditions
- Repeat steps 1-19 at noon on a cloudy day, and once around sunset
Results/Data Analysis
Data Output Done by Vernier Graphical Analysis Voltage Probe, Graphical Analysis Software, and Light Sensor
Data From The Test Without The Red LED Circuit
Table 1:Voltage for Time of Day and Solar Panel Type
| Time of Day | Solar Panel Type | Average Voltage (V) |
|---|---|---|
| Sunny | Control | 3.326 |
| Sunny | Mirror | 3.278 |
| Sunny | Magnifying Glass | 3.324 |
| Cloudy | Control | 3.430 |
| Cloudy | Mirror | 3.524 |
| Cloudy | Magnifying Glass | 3.452 |
| Sunset | Control | 1.758 |
| Sunset | Mirror | 1.830 |
| Sunset | Magnifying Glass | 1.765 |
Sunny
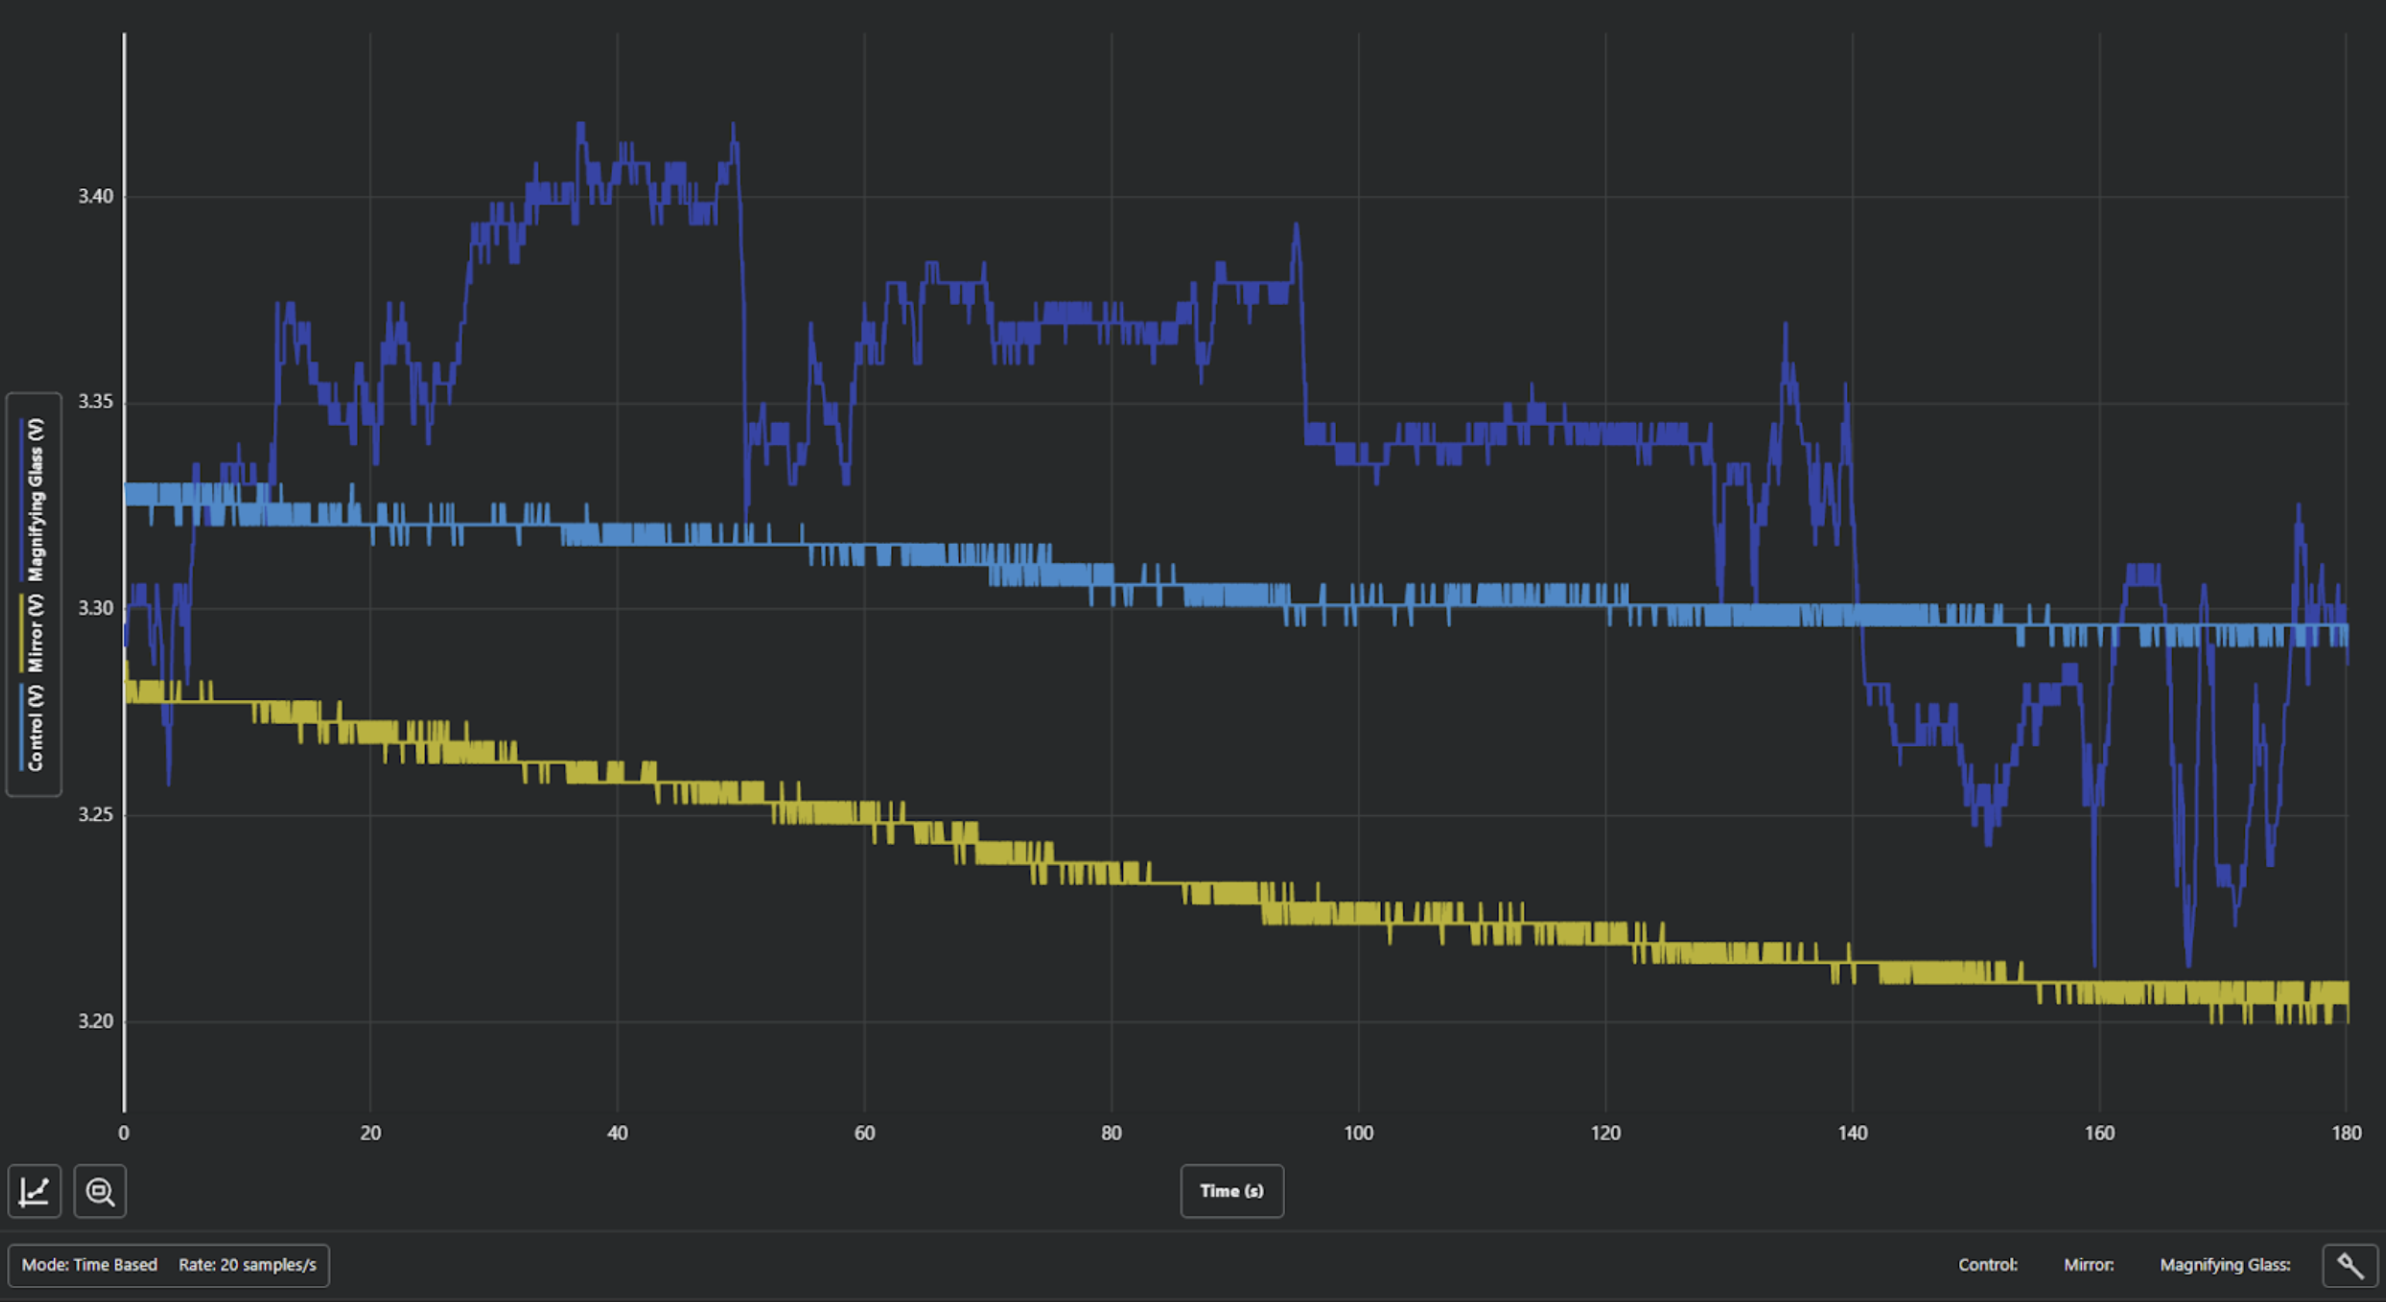
Figure 1:Voltage output of solar panel at noon on a sunny day
This graph (Figure 1) of the voltage output of each solar panel shows when they were tested at noon on a sunny day. This graph along with the statistics in the table above show that the voltage outputs in a sunny light condition were very similar. The Control and Mirror followed a similar trend while the Magnifying Glass had a very inconsistent trend. That is likely due to the many variables that could affect the output of the solar panel like the heat, because solar panels do not work well when hot, and a magnifying glass can concentrate light causing the heat to also rise which could be a possible explanation for the Magnifying Glass’s voltage output trend.
Cloudy
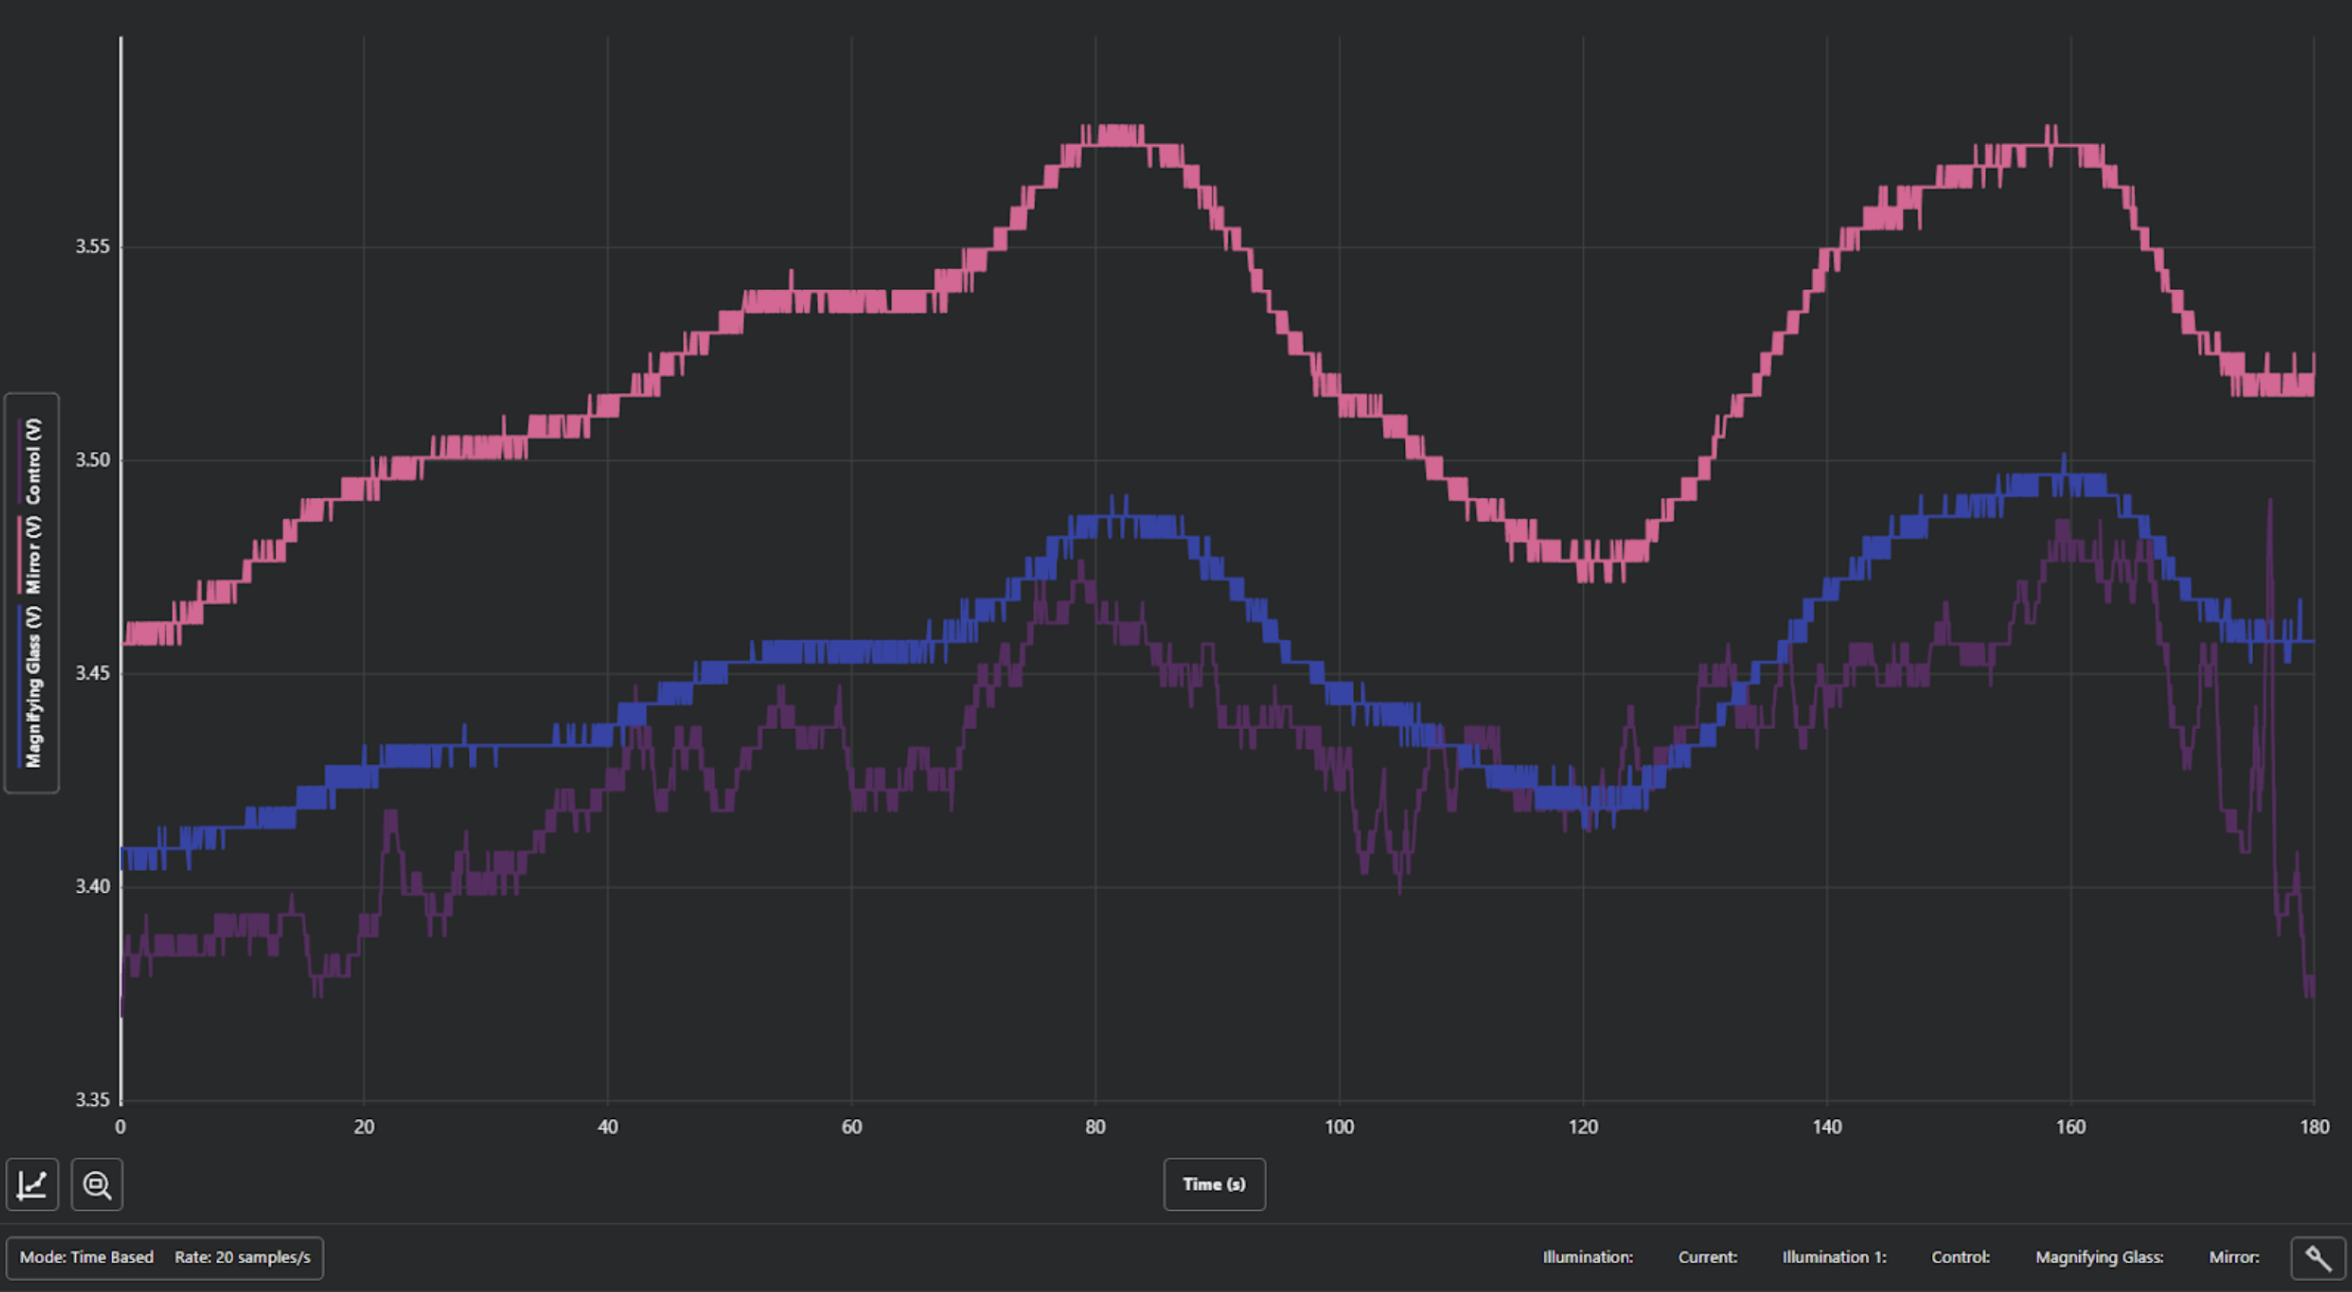
Figure 2:Voltage output of solar panel at noon on a cloudy day
This graph (Figure 2) of the voltage output of each solar panel shows when they were tested on a cloudy day. The voltages for all 3 light modifying conditions seem to have followed a similar wave like trend that was likely caused by a change in lighting as the clouds moved. The graph clearly shows how the solar panel which utilized the mirror had a greater voltage output for the entirety of the test while the control and the magnifying glass solar panels were very similar in voltage output with only a 0.022V difference in average. The mirror solar panel was able to output a voltage that was 0.096V greater than the control on average which is shown by the statistics in the table above.
Sunset
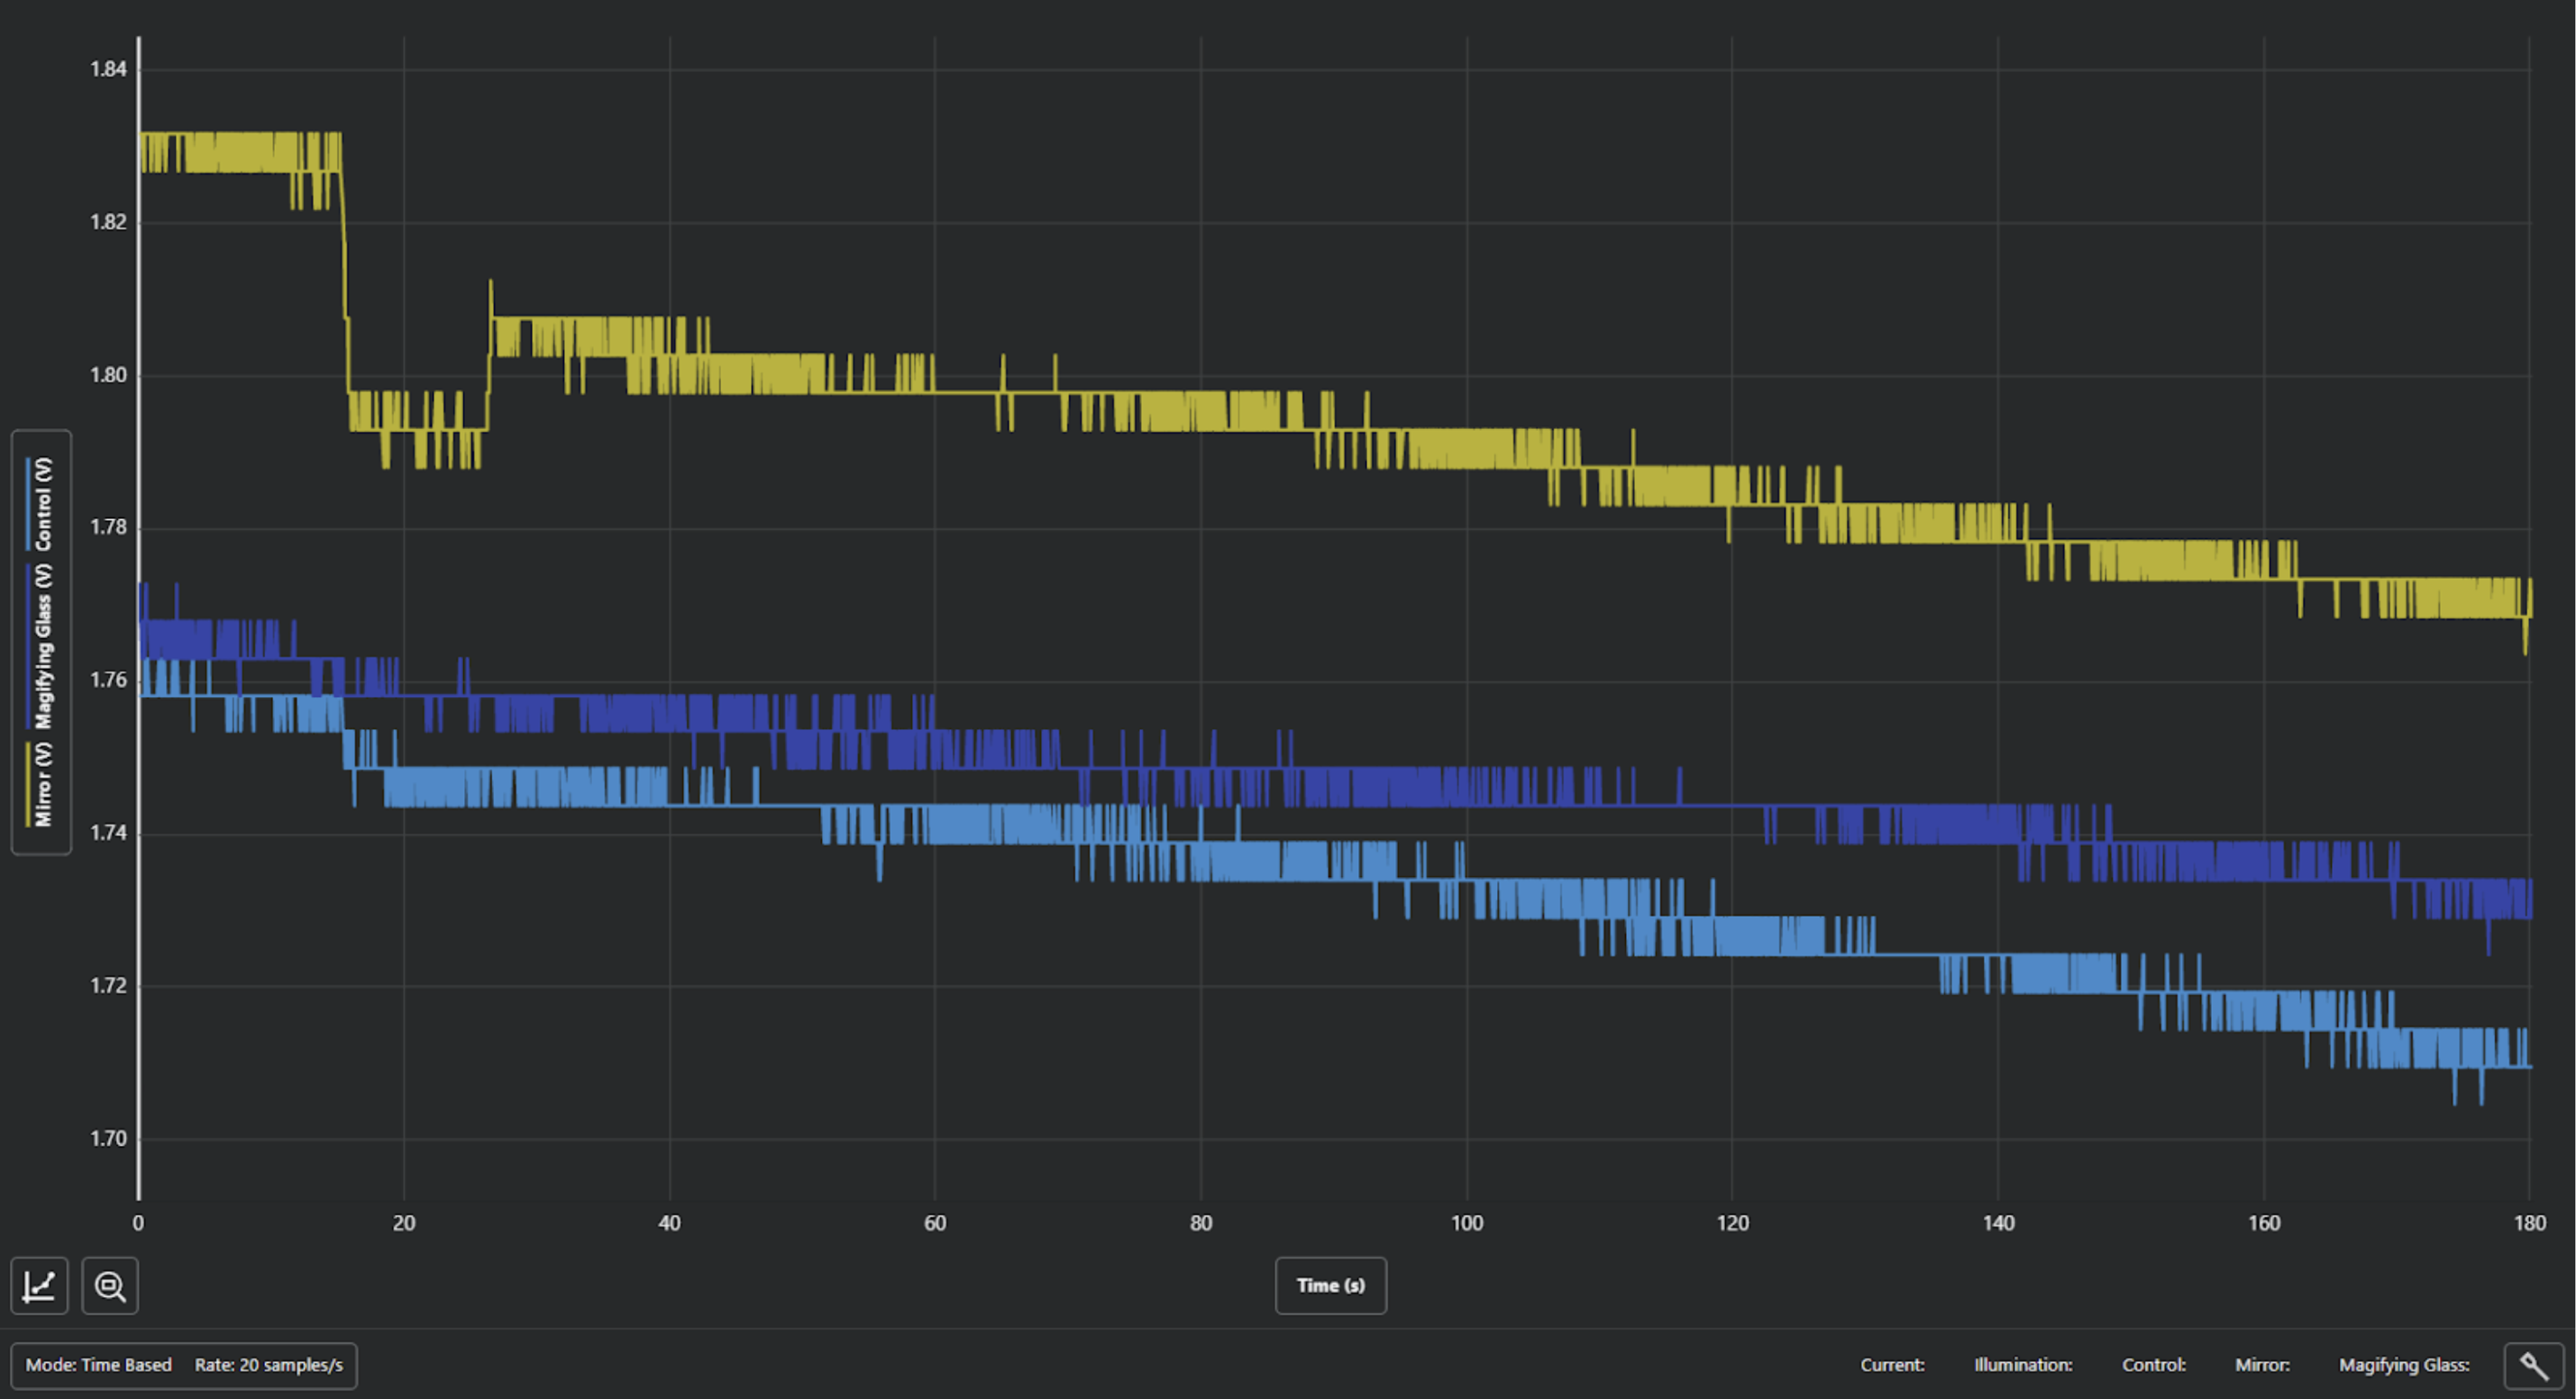
Figure 3:Voltage output of solar panel during sunset
This graph (Figure 3) of the voltage output of each solar panel shows when they were tested during a sunset. The voltages for all 3 light modifying conditions seem to have followed the same declining trend which was likely caused by the sun going down as it set. This graph shows the mirror solar panel having the greatest voltage output followed by the magnifying glass solar panel, which is followed by the control solar panel that that is not experiencing any light modification. The mirror likely was able to produce the greatest voltage output as the mirror was situated behind the solar panel allowing the solar panel to get hit by the photons that reach the panel direction, in addition to the photons that are reflected onto the solar panel by the mirror. The statistics in the table on above show that the mirror solar panel was able to produce an output that was 0.072V greater than the output of the control on average.
Data From Trials With The LED Circuit
Table 2:Voltage and Illuminance for Time of Day and Solar Panel Type
| Time of Day | Solar Panel Type | Trial Number | Avg Voltage per Trial (V) | Illuminance (Lux) |
|---|---|---|---|---|
| Noon & Sunny | Control | Trial 1 | 3.276 | 119313 |
| Noon & Sunny | Control | Trial 2 | 3.170 | 118753 |
| Noon & Sunny | Control | Trial 3 | 3.287 | 118565 |
| Noon & Sunny | Mirror | Trial 1 | 3.349 | 118894 |
| Noon & Sunny | Mirror | Trial 2 | 3.310 | 118041 |
| Noon & Sunny | Mirror | Trial 3 | 3.279 | 117258 |
| Noon & Sunny | Magnifying Glass | Trial 1 | 3.321 | 118800 |
| Noon & Sunny | Magnifying Glass | Trial 2 | 3.214 | 118753 |
| Noon & Sunny | Magnifying Glass | Trial 3 | 3.235 | 117821 |
| Cloudy | Control | Trial 1 | 3.393 | 47260 |
| Cloudy | Control | Trial 2 | 2.476 | 42250 |
| Cloudy | Control | Trial 3 | 1.846 | 38261 |
| Cloudy | Mirror | Trial 1 | 3.201 | 44530 |
| Cloudy | Mirror | Trial 2 | 3.045 | 42340 |
| Cloudy | Mirror | Trial 3 | 2.592 | 39764 |
| Cloudy | Magnifying Glass | Trial 1 | 3.420 | 45670 |
| Cloudy | Magnifying Glass | Trial 2 | 3.143 | 41380 |
| Cloudy | Magnifying Glass | Trial 3 | 1.848 | 40200 |
| Sunset | Control | Trial 1 | 1.867 | 544.321 |
| Sunset | Control | Trial 2 | 1.652 | 542.331 |
| Sunset | Control | Trial 3 | 1.701 | 542.935 |
| Sunset | Mirror | Trial 1 | 1.827 | 544.459 |
| Sunset | Mirror | Trial 2 | 1.836 | 541.454 |
| Sunset | Mirror | Trial 3 | 1.855 | 541.493 |
| Sunset | Magnifying Glass | Trial 1 | 1.841 | 545.961 |
| Sunset | Magnifying Glass | Trial 2 | 1.826 | 542.931 |
| Sunset | Magnifying Glass | Trial 3 | 1.805 | 540.348 |
Trial Data Calculations
Equations:
V = Voltage (Volts)
R = Resistance (Ohms)
I = Current (Amps)
P = Electrical Power (Watts)
Average =
Percent Change = %
*Resistance is 330 Ohms due to the 330 Ohm Resistor
Table 3:Statistics Calculated from Trial Data
| Time of Day | Solar Panel Type | Trial Number | Avg Voltage per Trial (V) | Avg Voltage (V) | Avg Current per Trial (mA) | Avg Current (mA) | Avg Wattage per Trial (W) | Avg Wattage (W) | % Δ Voltage & Current from Control | % Δ Wattage from Control |
|---|---|---|---|---|---|---|---|---|---|---|
| Sunny | Control | Trial 1 | 3.276 | 3.244 | 9.927 | 9.831 | 0.03252 | 0.03190 | 0 | 0 |
| Trial 2 | 3.170 | 9.606 | 0.03045 | |||||||
| Trial 3 | 3.287 | 9.961 | 0.03274 | |||||||
| Mirror | Trial 1 | 3.349 | 3.313 | 10.15 | 10.04 | 0.03399 | 0.03326 | 2.106 | 4.237 | |
| Trial 2 | 3.310 | 10.03 | 0.03320 | |||||||
| Trial 3 | 3.279 | 9.936 | 0.03258 | |||||||
| Magnifying Glass | Trial 1 | 3.321 | 3.257 | 10.06 | 9.869 | 0.03342 | 0.03215 | 0.3802 | 0.7555 | |
| Trial 2 | 3.214 | 9.739 | 0.03130 | |||||||
| Trial 3 | 3.235 | 9.803 | 0.03171 | |||||||
| Cloudy | Control | Trial 1 | 3.393 | 2.572 | 10.28 | 7.793 | 0.03489 | 0.02126 | 0 | 0 |
| Trial 2 | 2.476 | 7.503 | 0.01858 | |||||||
| Trial 3 | 1.846 | 5.594 | 0.01033 | |||||||
| Mirror | Trial 1 | 3.201 | 2.946 | 9.700 | 8.927 | 0.03105 | 0.02650 | 14.56 | 24.64 | |
| Trial 2 | 3.045 | 9.227 | 0.02810 | |||||||
| Trial 3 | 2.592 | 7.855 | 0.02036 | |||||||
| Magnifying Glass | Trial 1 | 3.420 | 2.804 | 10.36 | 8.496 | 0.03544 | 0.02524 | 9.021 | 18.71 | |
| Trial 2 | 3.143 | 9.524 | 0.02993 | |||||||
| Trial 3 | 1.848 | 5.600 | 0.01035 | |||||||
| Sunset | Control | Trial 1 | 1.867 | 1.740 | 5.658 | 5.273 | 0.01056 | 0.009200 | 0 | 0 |
| Trial 2 | 1.652 | 5.006 | 0.008270 | |||||||
| Trial 3 | 1.701 | 5.155 | 0.008768 | |||||||
| Mirror | Trial 1 | 1.827 | 1.839 | 5.536 | 5.574 | 0.01011 | 0.01025 | 5.709 | 11.44 | |
| Trial 2 | 1.836 | 5.564 | 0.01021 | |||||||
| Trial 3 | 1.855 | 5.621 | 0.01043 | |||||||
| Magnifying Glass | Trial 1 | 1.841 | 1.824 | 5.579 | 5.527 | 0.01027 | 0.01008 | 4.828 | 9.589 |

Figure 4:● = Control | ◆ = Mirror | ★ = Magnifying Glass
This chart (Figure 4) displays the output voltage measured during each of the 27 trials where the red dot is the average of the respective 3 trials. This chart shows how the voltage output for all 3 optical devices was relatively the same in the sunny sunlight condition, the mirror and the magnifying glass are slightly greater than control for the sunset scenario, and the mirror and magnifying glass are much greater than the control for the cloudy sunlight condition. The difference between control and the optical devices were greatest during the cloudy sunlight condition with it being greater for the mirror.

Figure 5:● = Control | ◆ = Mirror | ★ = Magnifying Glass
This chart (Figure 5) displays the current generated during each of the 27 trials based on the calculations done with Ohm’s Law. The red points show the average current generated during the respective set of 3 trials. This chart is very similar to the voltage chart with the only difference being the scale because current & voltage are directly proportional. For that reason all the points seem to be in the same position relative to each other and similar observations and conclusions to those made for the voltage graph can be made here.

Figure 6:● = Control | ◆ = Mirror | ★ = Magnifying Glass
This chart (Figure 6) displays the wattage output generated during each of the 27 trials. The red points show the average wattage generated during the respective 3 trials. This chart shows the data for the sunny condition trials and the sunset condition trials as being very clean and constant when compared to the cloudy condition trials which look like a mess of random points. However, the mess of random points makes sense for the cloudy trials as the sunlight conditions are not too constant when it is cloudy resulting in there not being a consistent line of points. Still the chart shows that the mirror performed better than the control in all the sunlight conditions with the difference not being very significant in sunny conditions. The magnifying glass performed similarly as shown by the chart, but its difference in wattage output when compared to the control was not as much as the mirror.
Conclusion
To conclude, the original hypothesis proved to be partially correct. At first, it was thought that on a sunny day, with the sun being at its highest point, the tools we use–a magnifying glass and mirror–wouldn’t show significant changes in voltage & current. This is because, with an additional light source beyond the sun at peak intensity, fewer electrons remain available for photons to strike, reducing the likelihood of dislodging more electrons. The final results show that with a magnifying glass on a sunny day, current & voltage have a 0.3802% increase and wattage has a 0.7555% increase. With a mirror under the same conditions, current & voltage have a 2.106% increase and wattage as a 4.237% increase. Since these percent changes were under 5% and really minimal, it’s safe to assume that this part of the hypothesis was correct in the sense that there weren’t any significant changes regarding voltage & current, and therefore, wattage as well.
The second part of the hypothesis, however, was not as accurate as initially thought. Flat mirrors reflect light at the angle of incidence, so not all light was predicted to hit the panel directly. However, the magnifying glass concentrated photons in one region, dislodging electrons only there and limiting voltage. In contrast, the mirror directed sunlight onto the panel while it also received light directly from the sun. Ultimately, directing light with the mirror proved more effective than concentrating it.
Ultimately, the purpose of this experiment was achieved because both the solar panel with a mirror reflecting light on it and the solar panel with the magnifying glass concentrating light on it performed better than the solar panel standing alone. In all 3 situations, this was proven to be true but primarily the percent increase was way bigger in the conditions under cloudy weather and during sunset. The voltage & current percent change for the mirror when it was cloudy was a 14.56% increase and the wattage percent change under the same conditions was a 24.64% increase. The voltage & current percent change for the magnifying glass when it was cloudy was a 9.021% increase and the wattage percent change under the same conditions was a 18.71% increase. Similarly, the voltage & current percent change for the mirror during sunset was a 5.709% increase and the wattage percent change under the same conditions was an 11.44% increase. And finally, for the magnifying glass, the voltage & current percent change during sunset was a 4.828% increase while the wattage percent change under the same conditions was a 9.589% increase. Overall, for the scenarios of cloudy weather or during sunset, with the exception of one, there was always a significant change, where the current, voltage, and wattage values increased, proving the experiment to be a success.
Even with a successful experiment there are some uncertainties and possible sources of error. One possible source of error for the voltage only tests is that 3 different solar panels were used to measure voltage under different optical conditions at the same time, but the different solar panels could have defects causing error when comparing the readings. In order to reduce that error, we added another part of the experiment where each optical condition is tested 3 times per sunlight condition to confirm the results from the previous part of the experiment. That section of the experiment also has the possibility for error, especially when it comes to the lighting and sunlight. In order to minimize error for that section of the experiment, the same Vernier tools, and solar panel were being used to avoid additional variables that could cause errors. Additionally, the method involved rotating through each optical condition, completing one trial per condition before starting the next round. That reduces the error as the duration of the trial is only one minute and they are constantly being rotated. The light sensor was also used to confirm that the sunlight condition was not changing drastically which is shown by the lux values, showing that the illuminance during all trials in each lighting condition were pretty similar. Those are the possible sources of error and how they were minimized while conducting the experiment.
Future Direction
With the conclusion that light enhancing tools such as magnifying glasses and mirrors boost solar panel energy output, it is possible to take these findings and apply them to locations utilizing solar panels. This technology could be especially beneficial in locations without access to the power grid or a reliable electricity source. An increased efficiency in solar panels could lead to wider adoption, as they would perform better in varying sunlight conditions. In turn, fossil fuel usage is decreased, greatly reducing greenhouse gas emissions and its effects on the environment.
Moreover, those methods to optimize solar energy extraction can also enhance existing panels, increasing green energy output. This would provide more reliable energy for remote regions where grid connection is costly or impractical. Integrating these methods into smaller-scale applications, like portable solar devices or off-grid systems, could improve energy access in underserved areas and reduce environmental footprints.
With this energy optimization, the future implications are limitless, not only restricted to just powering homes. From applying this technology in water desalination or agricultural systems to solar-powered air purifiers in urban environments, the possibility to make the world a more sustainable place to thrive is very much still alive. What started as a simple experiment using mirrors and magnifying glasses points to innovative new ways to harness solar energy and create lasting impact on the world.
Experiment Pictures
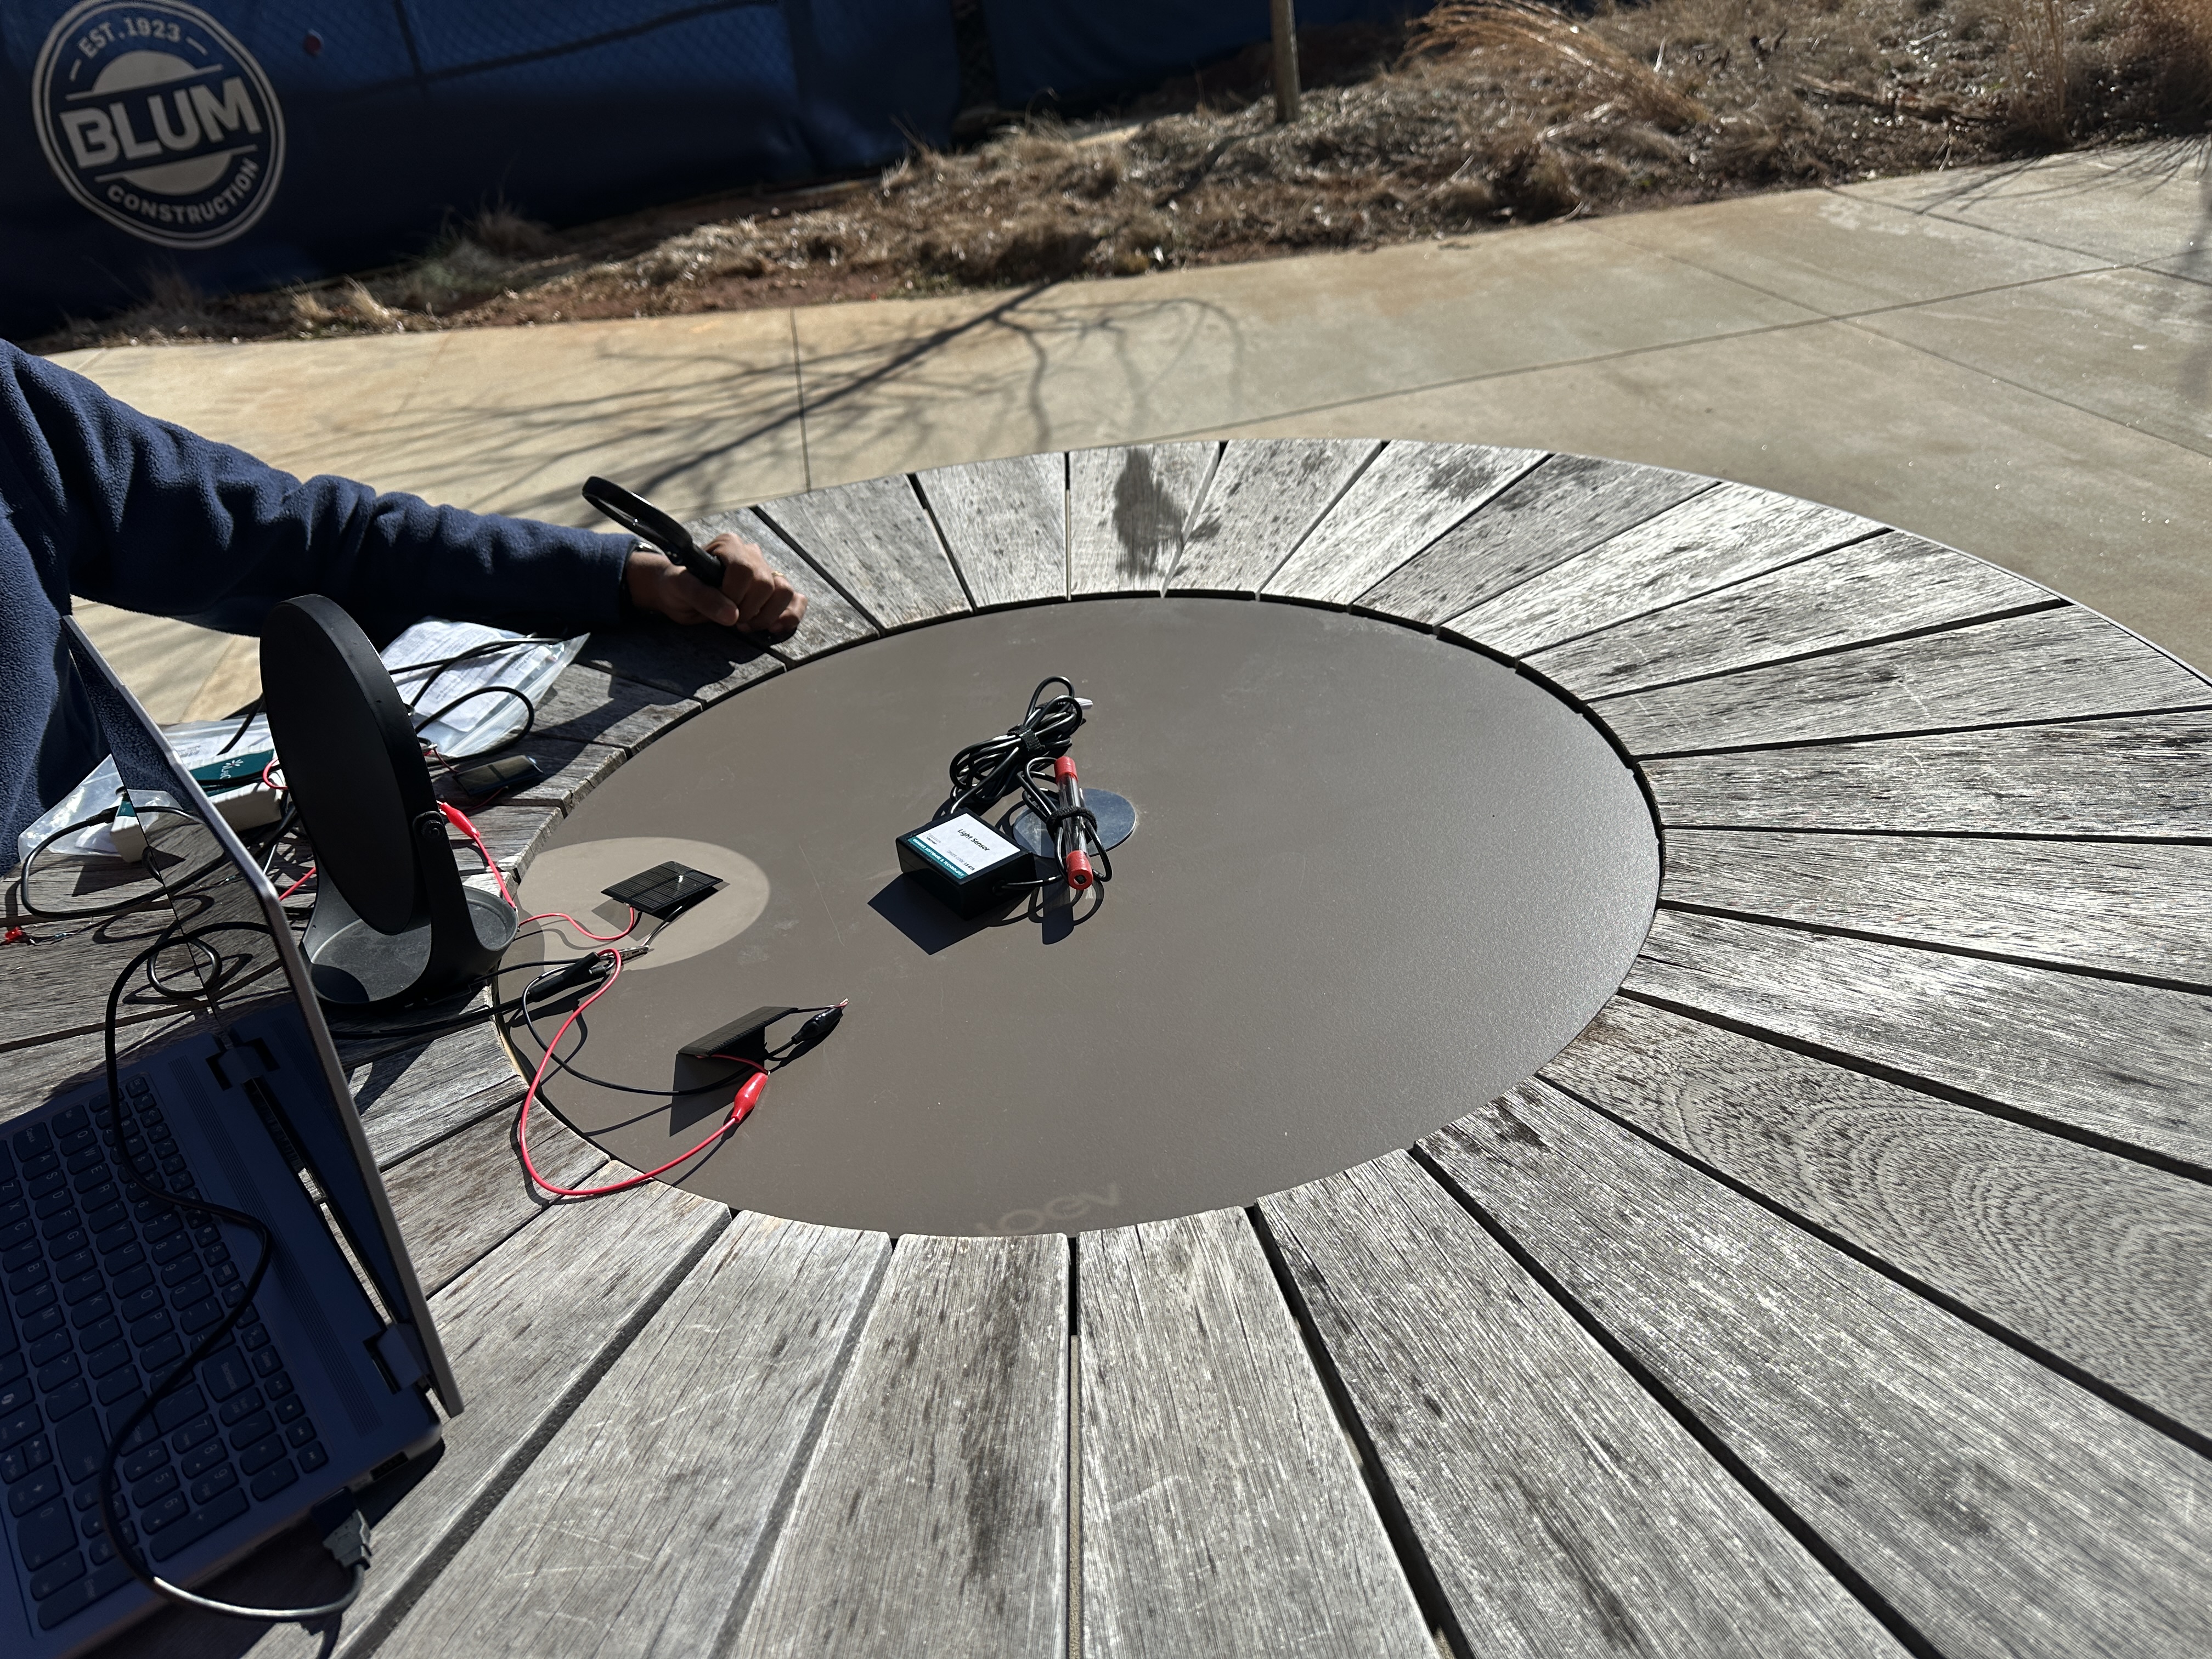
Figure 7:Experiment on Sunny Day at Noon
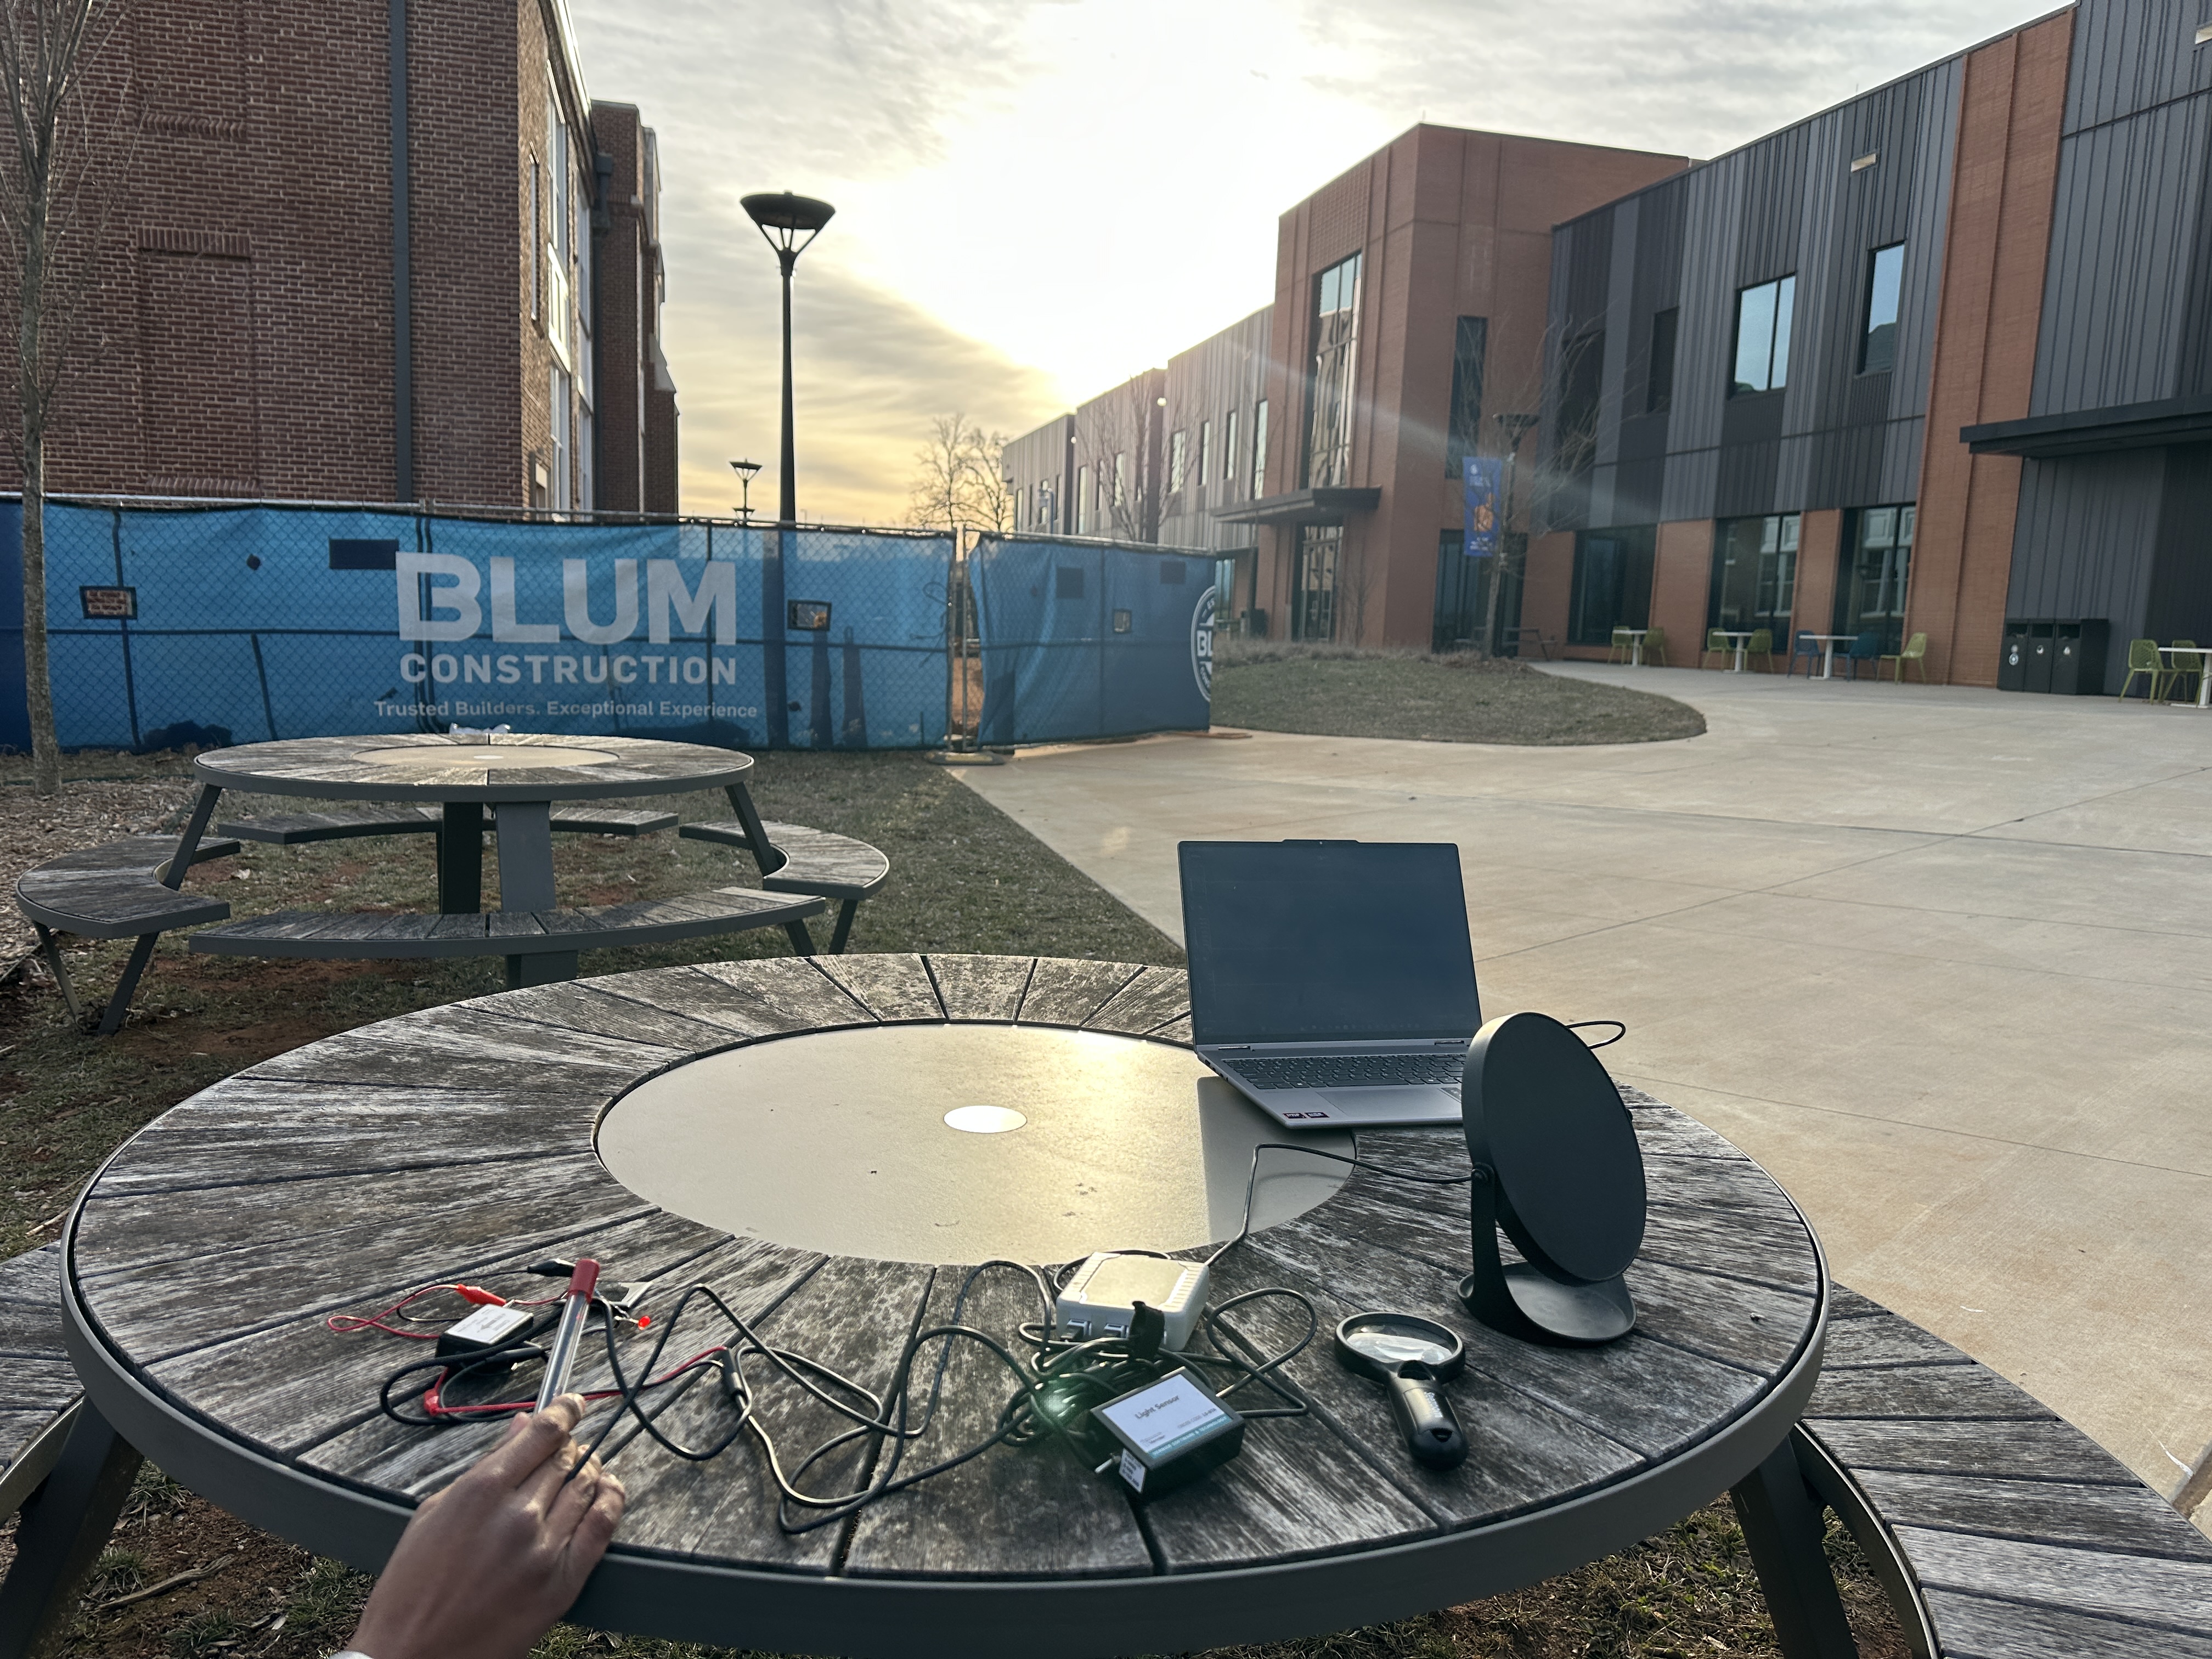
Figure 8:Experiment on Cloudy Day
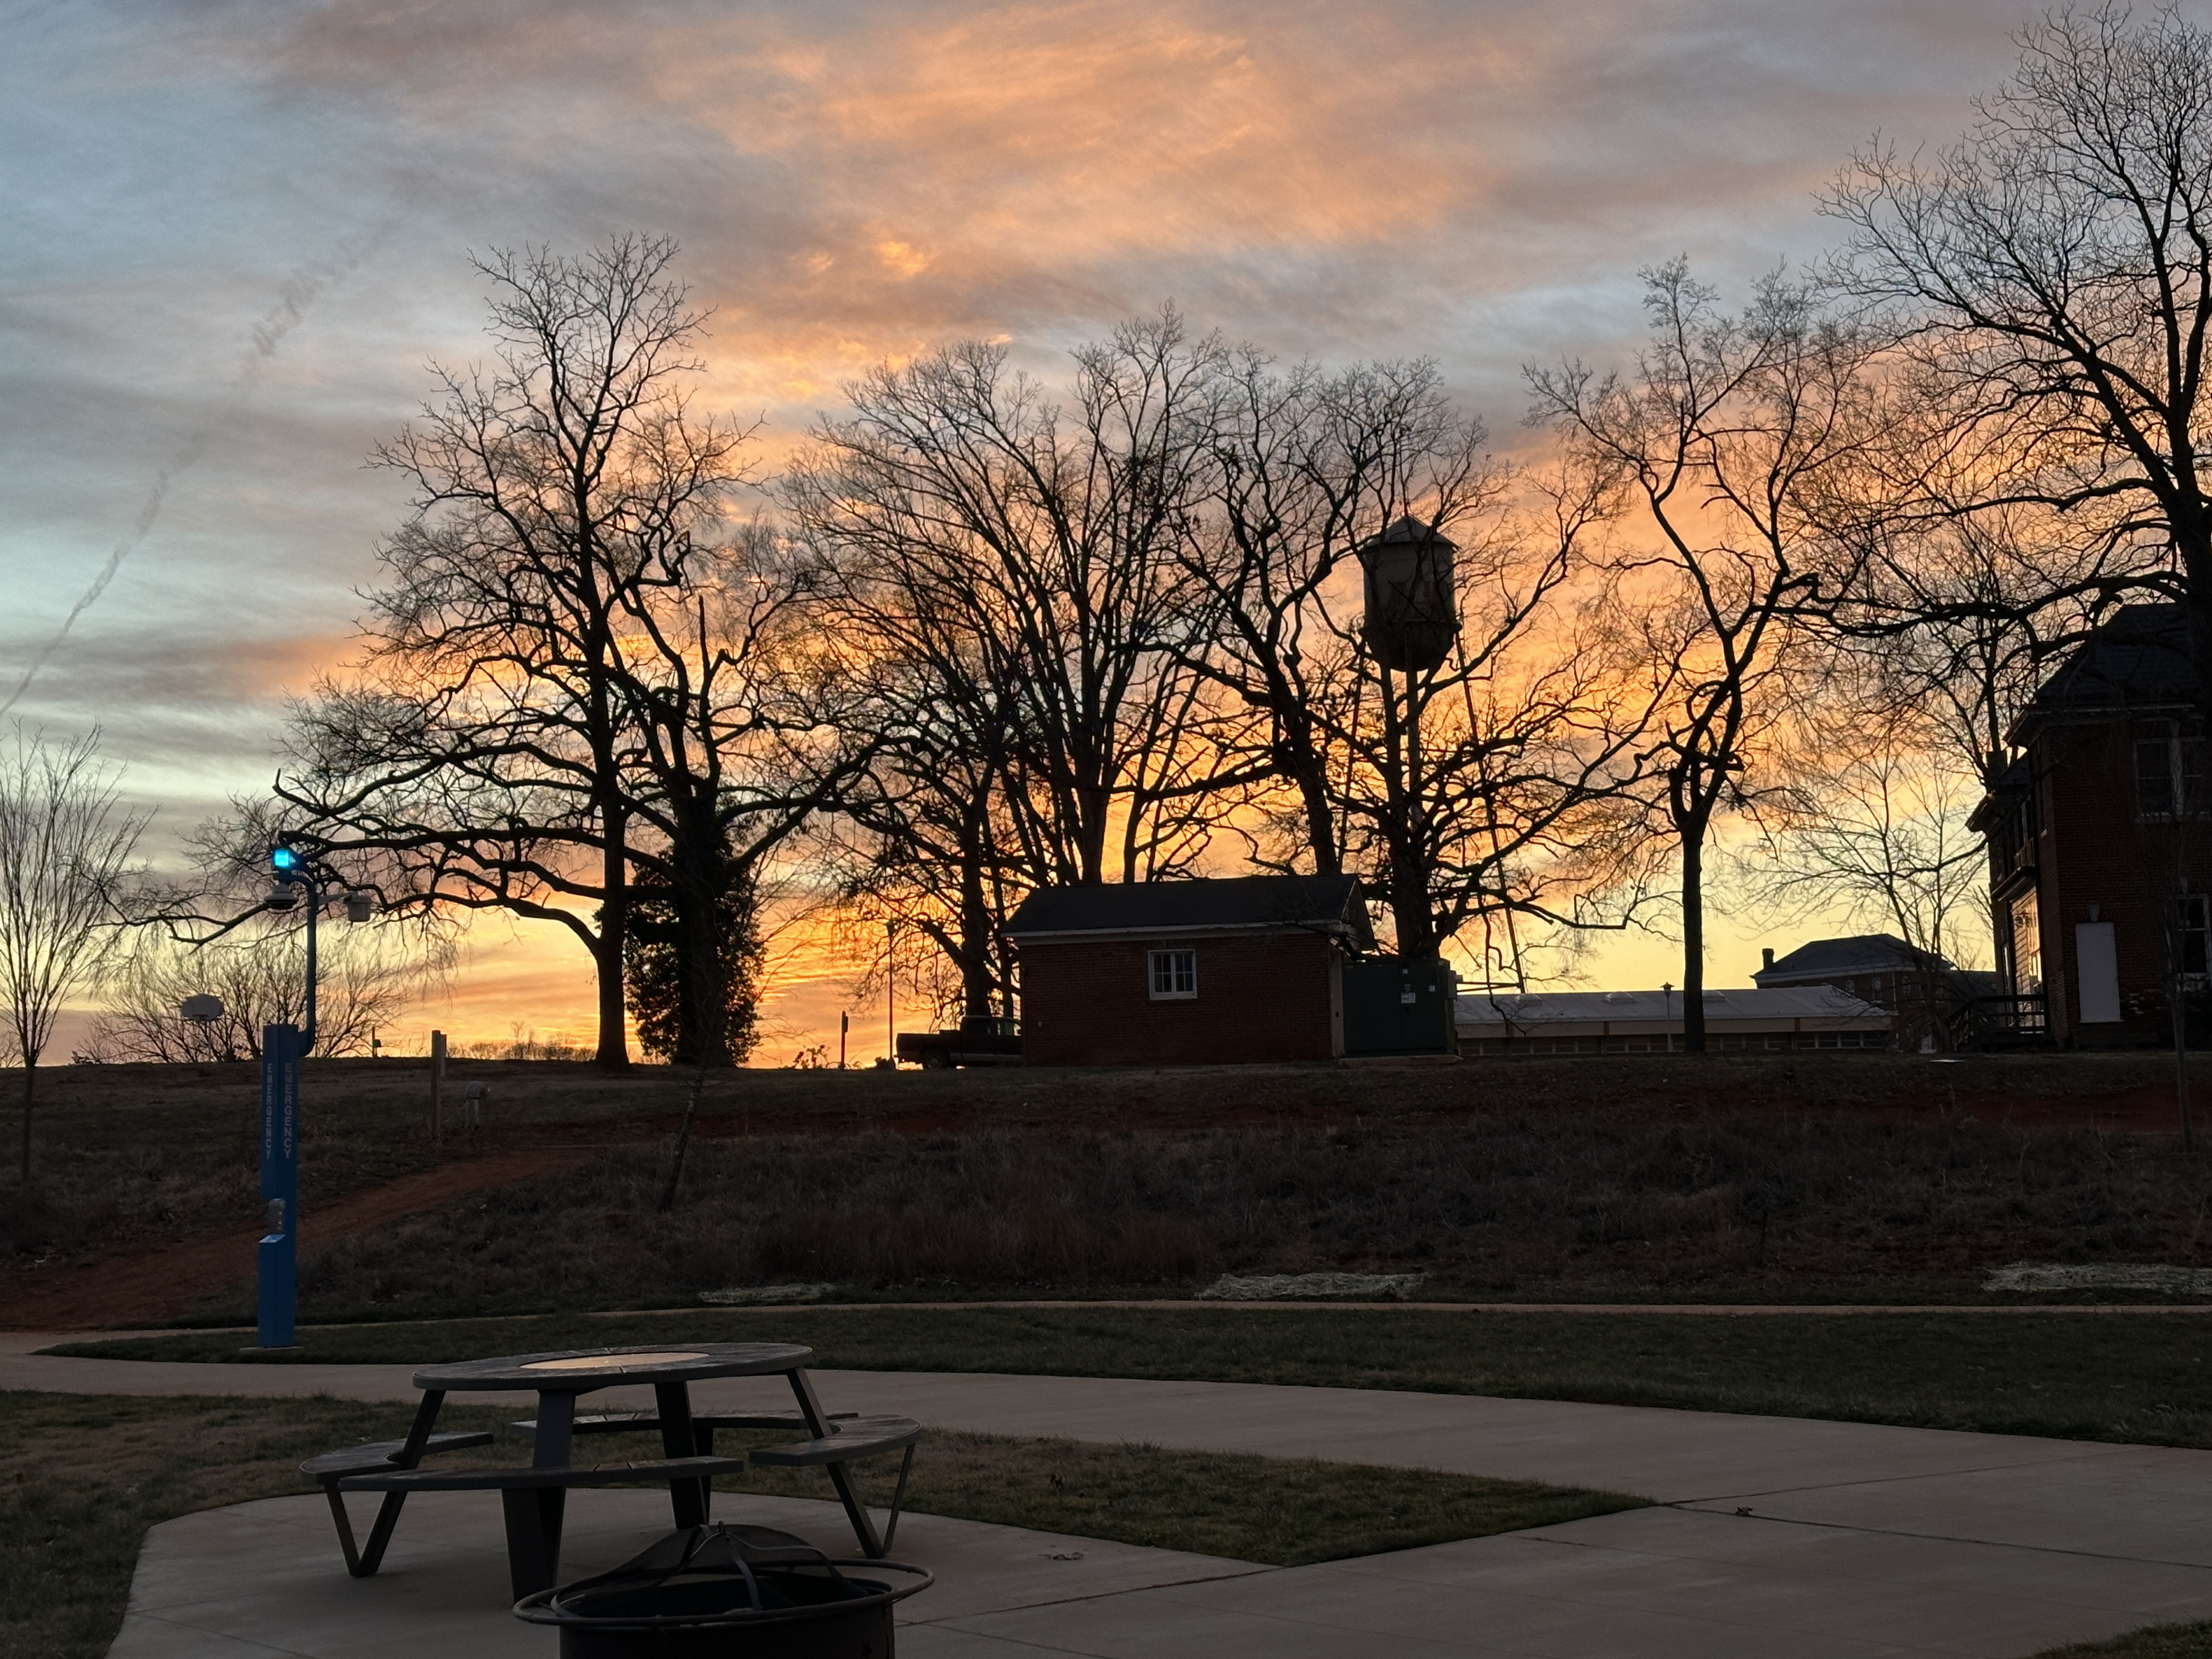
Figure 9:Experiment at Sunset
Copyright © 2024 Ramidi & Karthik. This is an open-access article distributed under the terms of the Creative Commons Attribution 4.0 International license, which enables reusers to distribute, remix, adapt, and build upon the material in any medium or format, so long as attribution is given to the creators.
- PV
- Photovoltaic
- Bolles, D. (n.d.). Carbon Dioxide Concentration | NASA Global Climate Change. In Climate Change: Vital Signs of the Planet. Retrieved April 6, 2025, from https://climate.nasa.gov/vital-signs/carbon-dioxide?intent=121.
- Manisalidis, I., Stavropoulou, E., Stavropoulos, A., & Bezirtzoglou, E. (2020). Environmental and Health Impacts of Air Pollution: A Review. Frontiers in Public Health, 8, 14. 10.3389/fpubh.2020.00014
- Toothman, J., & Aldous, S. (2015). In How Solar Cells Work. http://wcpssccsi.pbworks.com/w/file/fetch/67747809/solar%20cells-11162012150624.pdf
- Tobias, R. R., Mital, M. E., Lauguico, S., Guillermo, M., Naidas, J. R., Lopena, M., Dizon, M. E., & Dadios, E. (2020). Design and Construction of a Solar Energy Module for Optimizing Solar Energy Efficiency. 2020 IEEE 12th International Conference on Humanoid, Nanotechnology, Information Technology, Communication and Control, Environment, and Management (HNICEM), 1–6. 10.1109/HNICEM51456.2020.9400127
- Arshad, R., Tariq, S., Niaz, M. U., & Jamil, M. (2014). Improvement in solar panel efficiency using solar concentration by simple mirrors and by cooling. 2014 International Conference on Robotics and Emerging Allied Technologies in Engineering (iCREATE), 292–295. 10.1109/iCREATE.2014.6828382