
Evaluating the Effects of Lactic Acid Fermented Foods on Type 2 Diabetes Mellitus using Bombyx Mori Silkworms
Abstract
Type 2 diabetes mellitus (T2D) continues to rise globally, highlighting an urgent need for effective and accessible interventions. In this study, Bombyx mori silkworms were employed as a novel, cost-effective model to evaluate the impact of lactic acid fermented foods on hyperglycemia. Thirty silkworms were randomly divided into three groups: Group 1 (control diet), Group 2 (10% glucose diet), and Group 3 (10% glucose diet plus probiotic supplementation). Following a period of induced hyperglycemia in Groups 2 and 3, hemolymph samples were collected and assessed for relative glucose levels using a colorimetric quantitation assay.
Results indicated that while both Groups 2 and 3 exhibited higher hemolymph glucose levels than controls, silkworms receiving the probiotic supplement (Group 3) generally showed lower glucose concentrations compared to those fed only the high-glucose diet (Group 2). These observations, although modest, support the hypothesis that lactic acid bacteria (LAB) in fermented foods can reduce hyperglycemia in silkworms, likely through mechanisms such as improved insulin sensitivity or enhanced metabolic regulation.
Despite the promising findings, a key limitation of this pilot study was the small sample size, which restricted statistical power. Future research should include larger experimental groups, investigate strain-specific probiotic effects, and explore mechanistic pathways such as insulin receptor gene expression and gut microbiota shifts. Nonetheless, this work highlights the value of Bombyx mori as a physiologically relevant model for T2D and suggests that LAB-rich fermented foods may offer an accessible dietary strategy to help manage hyperglycemia.
Introduction
Diabetes is a global health crisis, affecting an estimated 463 million people worldwide as of 2019, with projections suggesting this number will rise to 700 million by 2045 (Home (n.d.)). The disease not only imposes a significant burden on individuals but also on healthcare systems and economies. In 2019, diabetes-related health expenditure reached $760 billion globally (Home (n.d.)). The most common form of diabetes, Type 2 diabetes (T2D), is characterized by insulin resistance and chronic hyperglycemia. As the prevalence of T2D continues to rise, there is an urgent need for effective, accessible, and affordable treatment options.
Current research indicates that the development of T2D involves a complex interplay of genetic, environmental, and lifestyle factors. Insulin resistance, a potential indication of T2D, occurs when cells in the body become less responsive to insulin, leading to elevated blood glucose levels. Persistent hyperglycemia over time can lead to severe complications, including cardiovascular disease, kidney failure, and nerve damage (Standards of Medical Care in Diabetes (2021)). The urgent need for new therapeutic strategies drives ongoing research into alternative treatments for T2D.
Bombyx mori silkworms have recently emerged as a promising model organism for studying T2D due to their unique physiological characteristics. Silkworm larvae progress through multiple instars, which are the developmental larval stages between molts, during which their metabolism and growth rates fluctuate significantly. Their prolegs, the fleshy, stub-like appendages on their abdomen, play a role in locomotion and feeding behaviors, which may influence glucose metabolism. These silkworms can develop hyperglycemia within 1-2 days when fed a high-glucose diet and exhibit insulin sensitivity similar to that of mammals (Hou et al. (2024)). This makes them an attractive model for large-scale studies due to their cost-effectiveness and ease of rearing.
Previous studies have demonstrated the potential of certain strains of lactic acid bacteria (LAB) in managing blood glucose levels. For instance, Lactococcus lactis has been shown to suppress glucose levels in silkworms, exhibiting immunoreactive properties that may contribute to its therapeutic effects (Matsumoto et al. (2016)). Moreover, LAB strains from fermented foods, such as those isolated from dairy products and vegetables, have been highlighted for their probiotic potential, which could be leveraged in managing T2D (Ismail et al. (2018); Sethi et al. (2023); Yang & Yoon (2022)).
Fermented foods, which are rich in LAB, have long been recognized for their health benefits. For example, kefir and Greek yogurt contain LAB strains that enhance gut health and may influence glucose metabolism (Ismail et al. (2018); Yang & Yoon (2022)). Similarly, fermented beverages like kombucha are being explored for their ability to enhance biological activities due to their LAB content (Nguyen et al. (2015)). These findings suggest that the probiotic potential of LAB strains in fermented foods could play a role in T2D management.
This study aims to investigate the effects of LAB strains from various fermented foods on blood glucose levels in Bombyx mori silkworms, with the hypothesis that some LAB strains will significantly reduce hemolymph glucose levels compared to controls and other strains.
Methods
Silkworm Preparation
To investigate the effect LAB strains have on hemolymph glucose levels, a batch of 30 small Bombyx mori silkworms was purchased from Coastal Silkworms. Upon arrival, these silkworms were randomly sorted into three experimental groups (Groups 1, 2, and 3) without discriminating between size and length. Each group was housed in a separate container and maintained under identical conditions to ensure consistency. These containers and group assignments were used throughout the experiment.
Habitat Preparation
To maintain a controlled environment conducive to optimal silkworm growth and development, a specialized habitat was prepared using a HovaBator incubator. The silkworms were placed in the incubator at 26–28°C and 75–85% relative humidity. These conditions were kept constant until silkworms reached the 5th instar, at which point the temperature was decreased to 16–18°C and relative humidity to 65–75% to prolong the 5th instar period. A digital thermometer and hygrometer were placed inside the incubator (under the transparent lid) to continuously monitor temperature and humidity levels.
Diet Preparation
All three groups were initially reared on the same normal, artificial “Silkworm Chow” mulberry diet (Carolina Biological), with fresh food provided every other day or when moisture loss became excessive. After 1–2 weeks, only Groups 2 and 3 were switched to a 10% w/v glucose mulberry diet, consisting of 90% normal diet mixed with 10% dextrose, and fed this for 24–30 hours to induce hyperglycemia. Following this, only Group 3 was given an additional diet containing 9 mL of probiotic supplementation mixed into the original glucose diet for another 24–30 hours, after which the trials were conducted.
Probiotic Dilutions
For the probiotic supplement, Spring Valley’s Extra Strength Probiotic Dietary Supplement was used. 1 capsule was opened and its contents were poured and mixed into 1 mL of molecular biology grade water to create a 1010 CFU stock solution which was centrifuged at 6000 rpm for 3 minutes. A 1:10 serial dilution was performed to create additional concentrations of 109, 108, 107, and 106 CFU by taking 1 mL of the previous dilution mixed into 9 mL of molecular biology grade water. This study proceeded to only use the 108 CFU solution as the probiotic treatment, as it had a suitable clarity that was not too transparent or too opaque, and was administered on the same day all the dilutions were made.
Weight Assay
To ensure consistency in size and health, only silkworms weighing at least 0.9 g were selected for trials. Silkworms under this threshold were considered to be underfed or otherwise suboptimal, which could compromise the accuracy of the data. No maximum weight limit was established, as the focus was on excluding individuals that appeared to be growing poorly. Each silkworm was weighed individually on an analytical balance every day to monitor growth and confirm normal feeding behavior.
Hemolymph Dilutions
Six different 5th instar silkworms were selected: two from Group 1 (control diet), two from Group 2 (glucose diet), and two from Group 3 (glucose + probiotic diet). To collect hemolymph, a small hole was created under the first proleg, and gentle pressure was applied to allow hemolymph to flow out. Exactly 4 μL of hemolymph was collected from each worm using a micropipette.
Each original 4 μL sample was then diluted in a 1:5 ratio by mixing it with 16 μL of assay buffer. From this dilution, 4 μL was taken and mixed with another 16 μL of assay buffer to create the next dilution. Repeating this process allowed the creation of sequential dilutions at 1/5, 1/25, 1/125, and 1/625 for every hemolymph sample collected.
Glucose Quantitation Assay
Kit and Stock Preparation
Relative glucose concentrations in hemolymph were measured using AAT Bioquest’s Amplite Colorimetric Glucose Quantitation Kit. Seven glucose standards (GS1 – GS7) were prepared via a 1:2 serial dilution of a 100 μM stock, producing 50, 25, 12.5, 6.3, 3.1, and 1.6 μM standards. All kit stock solutions were prepared according to the manufacturer’s instructions, then divided into 20 aliquots each to reduce freeze-thaw cycles and stored at –20°C when not in use. Working solution was freshly prepared on the day of testing.
Microplate Layout
A clear-bottom, 96-well microplate (12 columns × 8 rows) was used:
- Columns 1–2: Glucose standards (and blank) in duplicate.
- Columns 3–4: Hemolymph samples from two Group 1 silkworms.
- Columns 5–6: Hemolymph samples from two Group 2 silkworms.
- Columns 7–8: Hemolymph samples from two Group 3 silkworms.
Standard Curve Wells
- Wells A1–A2 served as blank controls (50 μL assay buffer + 50 μL working solution).
- Wells B1–H2 contained 50 μL of the appropriate glucose standard plus 50 μL working solution (in duplicate, down the columns).
Hemolymph Sample Wells
For each diet group, rows A–D contained 45 μL assay buffer plus 5 μL of hemolymph dilution (1/5, 1/25, 1/125, or 1/625), topped off with 50 μL working solution (total 100 μL). Rows E–H contained 95 μL assay buffer plus 5 μL of the same hemolymph dilutions but no working solution; this helped account for any cloudiness or background absorbance caused by proteins, oxidation, or other sample components.
Assay Protocols
After loading all wells, the microplate was incubated at 37°C in three 10-minute intervals (10, 20, and 30 minutes). At each time point, the plate was transferred to a microplate reader, and absorbance was measured at 570 nm. Data from blank wells and standards were used to create a standard curve for determining relative glucose concentrations in each hemolymph sample.
Results
Glucose Quantitative Assay
For each of the 10 minute intervals, using the absorbance data from columns 1 and 2, the values in each row were averaged and the blank standard in row A was subtracted out from the standards in the remaining rows. Using these new values, a standard curve was created with the glucose standards and regression line plotted, as well as the regression line equation.

Figure 1:Standard Curve of Absorbances of Glucose Standards after 10 minutes of incubation at 37°C.

Figure 2:Standard Curve of Absorbances of Glucose Standards after 20 minutes of incubation at 37°C.

Figure 3:Standard Curve of Absorbances of Glucose Standards after 30 minutes of incubation at 37°C.
The same was done with the test sample columns, where the blanks were subtracted, the 2 replicates for each group were averaged, and absorbance values were converted into the “relative” glucose concentration values, which are not the same as the absolute glucose concentration values. Below are the concentration and absorbance graphs for each dilution from each 10 minute interval of incubation:

Figure 4:Absorbance and Glucose Concentration Data for the 1/50 dilution samples incubated for 10 minutes. In both graphs, the values for the Group 2 and Group 3 worms are higher than the control, confirming that glucose concentration increased after having a diet that consisted of glucose. Very slight statistical difference between Group 2 and Group 3, if any.

Figure 5:Absorbance and Glucose Concentration Data for the 1/250 dilution samples incubated for 10 minutes. In both graphs, the values for the Group 2 and Group 3 worms are higher than the control, confirming that glucose concentration increased after having a diet that consisted of glucose. Strong statistical difference between Group 2 and Group 3, indicating glucose concentration dropped in Group 3 worms after adding probiotics to their diet.

Figure 6:Absorbance and Glucose Concentration Data for the 1/1250 dilution samples incubated for 10 minutes. In both graphs, the values for the Group 2 and Group 3 worms are higher than the control, confirming that glucose concentration increased after having a diet that consisted of glucose. Statistical difference between Group 2 and Group 3 is present, indicating glucose concentration dropped in Group 3 worms after adding probiotics to their diet.

Figure 7:Absorbance and Glucose Concentration Data for the 1/6250 dilution samples incubated for 10 minutes. In both graphs, the values for the Group 2 and Group 3 worms are higher than the control, confirming that glucose concentration increased after having a diet that consisted of glucose. However, after data analysis, it appears that there is no difference that is statistically significant between the three groups.

Figure 8:Absorbance and Glucose Concentration Data for the 1/50 dilution samples incubated for 20 minutes. In both graphs, the values for the Group 2 and Group 3 worms seem to be around the same value as the control, indicating that there is no difference present that is statistically significant between the three groups.

Figure 9:Absorbance and Glucose Concentration Data for the 1/250 dilution samples incubated for 20 minutes. In both graphs, the values for the Group 2 and Group 3 worms are higher than the control, confirming that glucose concentration increased after having a diet that consisted of glucose. Statistical difference between Group 2 and Group 3 is present, indicating glucose concentration dropped in Group 3 worms after adding probiotics to their diet.

Figure 10:Absorbance and Glucose Concentration Data for the 1/1250 dilution samples incubated for 20 minutes. In both graphs, the values for the Group 2 and Group 3 worms are higher than the control, confirming that glucose concentration increased after having a diet that consisted of glucose. Statistical difference between Group 2 and Group 3 is present, indicating glucose concentration dropped in Group 3 worms after adding probiotics to their diet.

Figure 11:Absorbance and Glucose Concentration Data for the 1/6250 dilution samples incubated for 20 minutes. In both graphs, the values for the Group 2 and Group 3 worms are higher than the control, confirming that glucose concentration increased after having a diet that consisted of glucose. No difference that is statistically significant is present between Group 2 and Group 3.

Figure 12:Absorbance and Glucose Concentration Data for the 1/50 dilution samples incubated for 30 minutes. In both graphs, the values for the Group 2 and Group 3 worms seem to be slightly lower than the control, indicating that there is no difference present that is statistically significant between the three groups.

Figure 13:Absorbance and Glucose Concentration Data for the 1/250 dilution samples incubated for 30 minutes. In both graphs, the values for the Group 2 and Group 3 worms are higher than the control, confirming that glucose concentration increased after having a diet that consisted of glucose. No difference that is statistically significant is present between Group 2 and Group 3.

Figure 14:Absorbance and Glucose Concentration Data for the 1/1250 dilution samples incubated for 30 minutes. In both graphs, the values for the Group 2 and Group 3 worms are higher than the control, confirming that glucose concentration increased after having a diet that consisted of glucose. Statistical difference between Group 2 and Group 3 is present, indicating glucose concentration dropped in Group 3 worms after adding probiotics to their diet.

Figure 15:Absorbance and Glucose Concentration Data for the 1/6250 dilution samples incubated for 30 minutes. In both graphs, the values for the Group 2 and Group 3 worms are higher than the control, confirming that glucose concentration increased after having a diet that consisted of glucose. Statistical difference between Group 2 and Group 3 is present, indicating glucose concentration dropped in Group 3 worms after adding probiotics to their diet.
Below are the raw data from all three time intervals, which served as the basis for data processing and the calculation of absorbance and glucose concentrations:
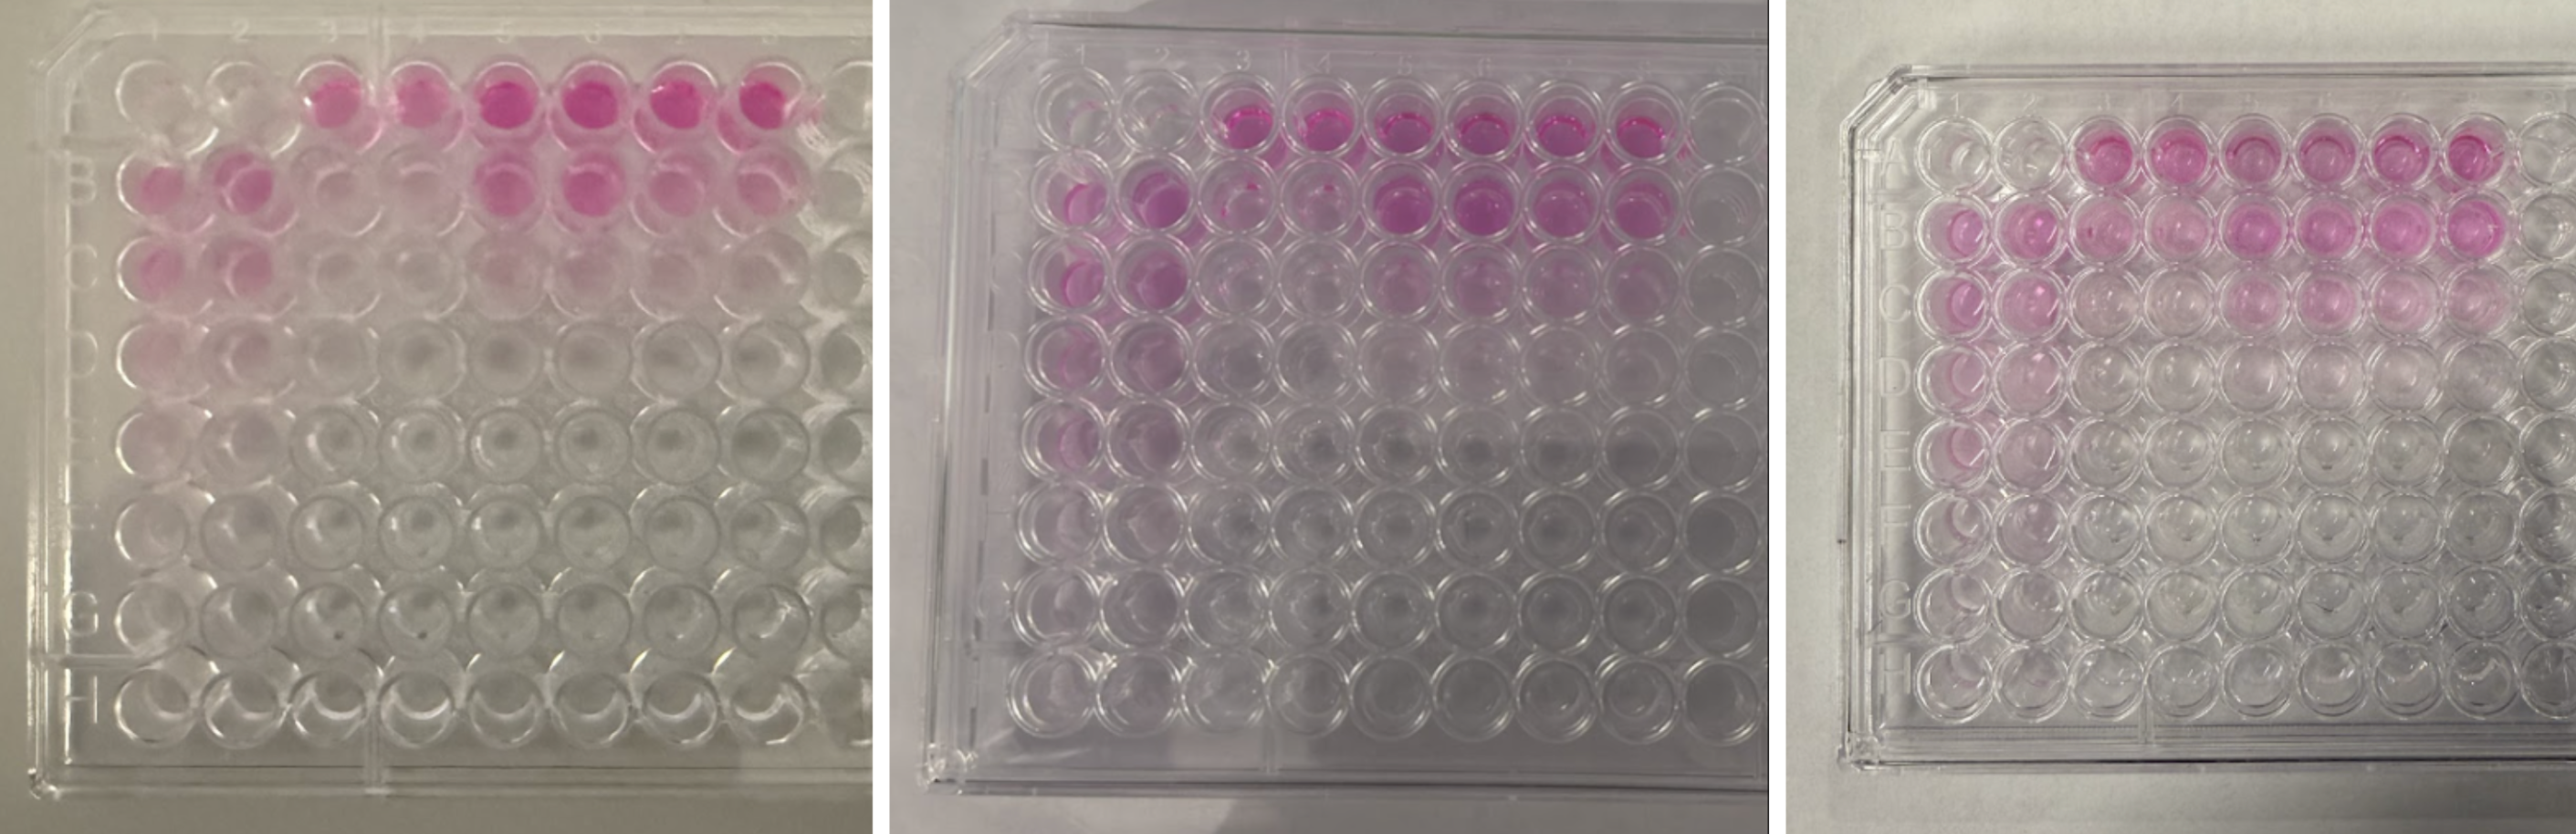
Figure 16:From left to right: 10 minutes, 20 minutes, and 30 minutes after incubating hemolymph samples. Overall, the concentrations of the working assay are increasing over time among the samples. A clear difference is observable between the Group 1 and Groups 2/3 column concentrations.
Discussion
The findings of this study suggest that probiotic supplementation that contains a majority of lactic acid bacteria (LAB) may help mitigate hyperglycemia in Bombyx mori silkworms induced by a high-glucose diet. Compared to silkworms receiving only the glucose diet, those administered the glucose + probiotic diet generally demonstrated lower relative hemolymph glucose levels across multiple incubation time points and dilutions. While the differences varied in magnitude and were limited by the small sample size, the overall trend supports the hypothesis that introducing LAB strains can offer glycemic benefits in this novel insect model of Type 2 diabetes mellitus (T2D).
These observations are in line with previous reports that specific LAB strains, such as Lactococcus lactis, can reduce elevated glucose levels in silkworms (Matsumoto et al. (2016)). Various mechanisms have been proposed for these glucose-lowering effects, including enhanced insulin signaling, improved gut barrier function, and beneficial shifts in microbial composition (Nguyen et al. (2015); Yang & Yoon (2022)). Given that silkworms share certain physiological parallels with mammals, such as the ability to rapidly develop hyperglycemia and respond to insulin-like peptides, these findings hold promise for extrapolation to more complex organisms (Hou et al. (2024)).
Nevertheless, interpreting these results requires caution. One of the primary limitations of this study is the small sample size, as each dietary group was represented by only two silkworms in the glucose quantitation assay. Because the data are limited, its makes it much more difficult to reliably spot important differences and to be confident in any conclusions drawn. Additionally, the probiotic supplement used in this experiment was administered at a single concentration (108 CFU), and it is possible that different strains or dosages could yield varying effects on hemolymph glucose levels. Another consideration is the short exposure period to the probiotic diet: more extended feeding regimens or investigations over multiple instars might be necessary to observe sustained or more pronounced glycemic changes.
Future studies should prioritize increasing the number of silkworms in each group to bolster statistical confidence. Investigating strain-specific effects could also illuminate which LAB strains are most effective at reducing glucose levels. Moreover, studies aimed at elucidating mechanistic pathways, such as quantifying changes in key metabolic enzymes, insulin receptor gene expression, or gut microbiota composition, would provide deeper insights into how LAB supplementation exerts glycemic control. Long-term research examining whether LAB-induced glycemic improvements persist throughout the silkworm life cycle or across multiple generations could further clarify the potential of fermented foods as a strategy for T2D management.
In conclusion, this pilot study highlights the value of Bombyx mori silkworms as a low-cost, physiologically relevant model to explore interventions for T2D. The apparent efficacy of lactic acid bacteria in lowering hemolymph glucose levels in this model aligns with growing evidence that fermented foods rich in LAB may offer therapeutic benefits for glycemic control (Ismail et al. (2018); Sethi et al. (2023)). With larger-scale confirmatory studies and mechanistic research, especially ones that directly test with samples of lactic acid fermented food items, LAB supplementation may emerge as a simple yet effective dietary approach to complement existing T2D therapies.
I would like to sincerely thank Mrs. Jennifer Williams and Dr. Mareca Lodge for assisting with the experimental procedures and data analysis during the study.
Copyright © 2024 Gottumukkala. This is an open-access article distributed under the terms of the Creative Commons Attribution 4.0 International license, which enables reusers to distribute, remix, adapt, and build upon the material in any medium or format, so long as attribution is given to the creator.
- Home. (n.d.). In Diabetes Atlas. https://diabetesatlas.org/
- Standards of Medical Care in Diabetes. (2021). Diabetes Care, 44(Supplement_1), S1–S2. 10.2337/dc21-Sint
- Hou, J., Tan, C., Chen, N., Zhou, Y., Huang, S., Chen, H., & Qian, L. (2024). Establishment of diabetes mellitus model using Bombyx mori silkworms in a low‐temperature environment. Archives of Insect Biochemistry and Physiology, 115(1), e22083. 10.1002/arch.22083
- Matsumoto, Y., Ishii, M., & Sekimizu, K. (2016). An in vivo invertebrate evaluation system for identifying substances that suppress sucrose-induced postprandial hyperglycemia. Scientific Reports, 6(1), 26354. 10.1038/srep26354
- Ismail, Y., Yulvizar, C., & Mazhitov, B. (2018). Characterization of lactic acid bacteria from local cow´s milk kefir. IOP Conference Series: Earth and Environmental Science, 130, 012019. 10.1088/1755-1315/130/1/012019
- Sethi, P., Maharana, R., Ameeruddin, S., & Das, S. (2023). Isolation of probiotics and scientific validation of using curd and salad vegetables for health benefits. Research Journal of Berhampur University. https://www.researchgate.net/publication/376190174_Isolation_of_probiotics_and_scientific_validation_of_using_curd_and_salad_vegetables_for_health_benefits
- Yang, S.-Y., & Yoon, K.-S. (2022). Effect of Probiotic Lactic Acid Bacteria (LAB) on the Quality and Safety of Greek Yogurt. Foods, 11(23), 3799. 10.3390/foods11233799
- Nguyen, N. K., Dong, N. T. N., Nguyen, H. T., & Le, P. H. (2015). Lactic acid bacteria: promising supplements for enhancing the biological activities of kombucha. SpringerPlus, 4(1), 91. 10.1186/s40064-015-0872-3