Inhibition of TORC1 Pathway in Saccharomyces Cerevisiae to Induce Autophagy Using Graphene Oxide
Abstract
Alzheimer’s Disease (AD) is a neurodegenerative brain disorder that affects close to six million people in the US alone. The disease is characterized by amyloid beta plaque buildup in the brain which limits proper communication and connection between neurons. Patients with AD were shown to have lower rates of autophagy in neuronal cells. Autophagy is the cellular process by which waste buildup is broken down through lysosomal activity. In mammals, the activated mTORC1 pathway inhibits autophagy in the presence of growth factors and amino acids. To explore the potential of using autophagic activity to break down amyloid beta plaques, Saccharomyces Cerevisiae, which conserves mTORC1 as TORC1, could be used as a model organism. This project focuses on the inhibitory effectiveness of Graphene Oxide (GO) on the TORC1 pathway in S. cerevisiae. Firstly, the cytotoxicity of GO to the S. cerevisiae species was tested to ensure GO did not hamper cell proliferation by growing S. cerevisiae in a medium which included various concentrations of GO. Then, a fluorescent marker, Rosella, which indicates autophagic activity was used to measure the effects of GO. The S. cerevisiae was transformed with the Rosella plasmid to give it fluorescent properties, following which the S. cerevisiae was grown in the presence of various GO concentrations. The resultant emissions revealed the relationship between the concentration of GO and the induction of autophagy through inhibition of the TORC1 pathway. By inducing autophagy, GO could prove to be the key to breaking down amyloid beta plaques and treating AD.
Introduction
Alzheimer’s Disease
Alzheimer’s Disease (AD) is a neurodegenerative brain disorder that is also classified as a chronic form of progressive dementia Aging, 2021. In the US alone, there are almost six million people Wiley, 2022 living with AD with an estimated 500,000 new diagnoses per year Wiley, 2022. The brains of people diagnosed with AD are characterized by amyloid beta protein plaques and tau protein tangle buildups. These protein aggregates can block neurotransmission between neurons which can result in cell death Canada, n.d.. Over time, patients with AD experience a decrease in brain matter and cognitive function as neurons die off at a rapid rate due to intense plaque buildup in critical areas Canada, n.d..
With no cure, the global prevalence of AD is growing with an estimated 60% of the annual 10 million new cases of dementia coming from the disease Organization, 2023. Furthermore, the causes behind plaque buildup and the direct relationship between beta amyloid plaques and dementia is still unclear. As the WHO recognizes AD and dementia as public health priority, initiatives to understand and cure AD are increasingly vital to human health Organization, 2023.
Autophagy, mTOR Pathways, and Amyloid Beta Plaque Decomposition
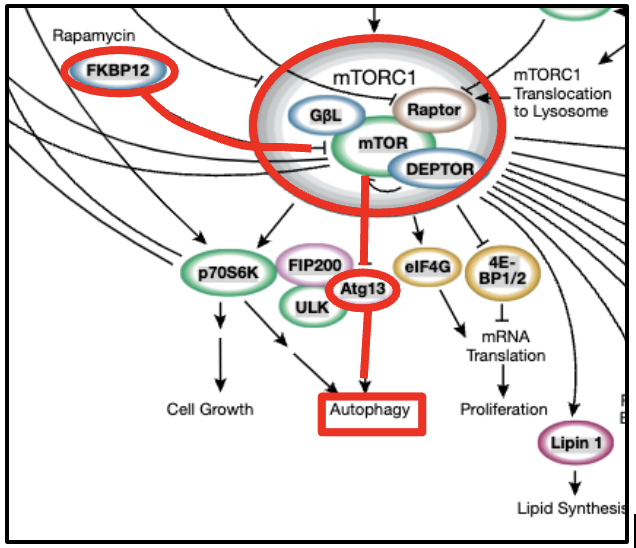
The mammalian mTOR is a serine/threonine kinase that is present in two complexes, mTORC1 and mTORC2. mTOR stands for mammalian Target Of Rapamycin, referencing a drug which is known to inhibit the pathway Zou et al., 2020.

Figure 1:The diagram of the mTORC1 pathway showing the activation of autophagy caused by inhibition of the phosphorylated ATG13 in the presence of Rapamycin.
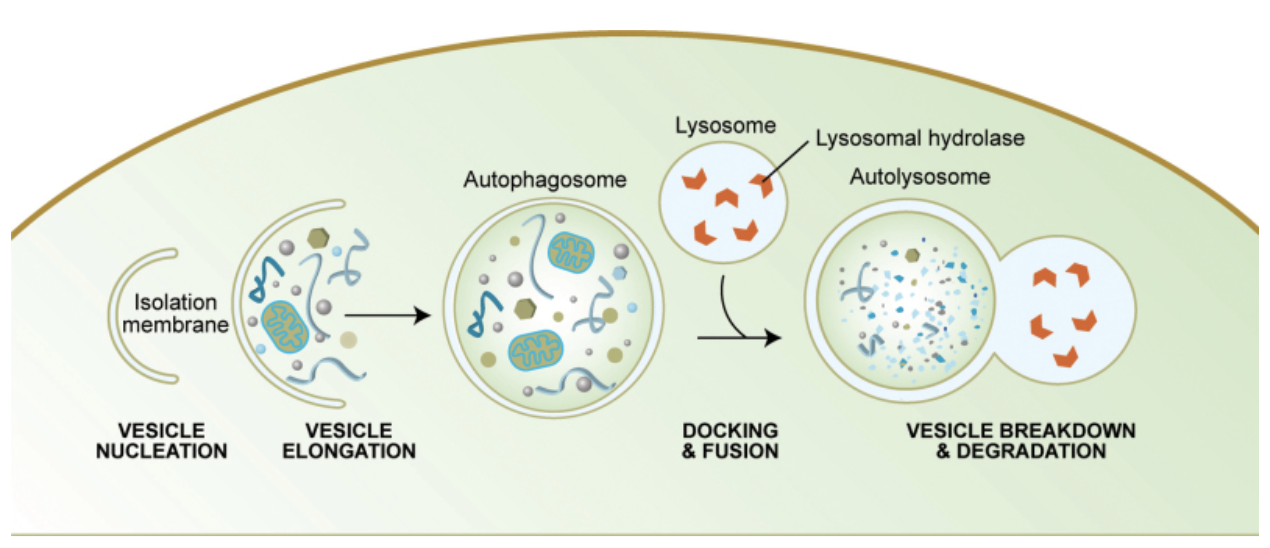
Both mTORC1 and mTORC2 regulate cell proliferation, autophagy and other growth-related processes in response to growth factors, hormones, and glucose Zou et al., 2020. Particularly mTORC1, activated in the presence of amino acids, phosphorylates protein ATG13; this protein inhibits the activation of autophagy, a process by which intracellular lysosomal activity decomposes aggregates.

Figure 2:The diagram of the autophagy shows the step-by-step process of how autophagy helps break down intracellular molecules.
In patients with AD, lysosomal activities in the brain related to autophagy have been shown to be impaired Uddin et al., 2018. Lower levels of Amyloid beta protein clearance through autophagy contributes to plaque buildup and progression of AD in these patients Li et al., 2020. Therefore, this experiment explores how inducing autophagy through inhibiting the mTORC1 pathway could help break down Amyloid beta plaques and prevent progression of AD.
Saccharomyces Cerevisiae
Saccharomyces Cerevisiae (S. cerevisiae) is a species of yeast commonly referred to as Brewer’s Yeast. S. cerevisiae is an appropriate model organism for autophagy-related research because it conserves a particular regulatory pathway with mammalian cells called mTOR as TOR Inoue & Nomura, 2018. Furthermore, S. cerevisiae can easily be cultivated and transformed while also maturing quickly and requiring little maintenance. The S. cerevisiae strain that was obtained for this project was genetically transformed in order to use fluorescent markers to detect autophagy Rangarajan et al., 2020.
Graphene Oxide
Graphene Oxide (GO) is made up of a layered carbon structure with functional groups containing oxygen Jiříčková et al., 2022. It has been shown to have promising properties for numerous applications including field-effect transistors, biomolecule sensors, graphene batteries, and conductive films. GO has also been shown to be a potential inhibitor to various intracellular pathways Trusek et al., 2020. Particularly, supporting evidence shows that GO could induce autophagy in human microglia and neurons Li et al., 2020. In this experiment, GO is tested as a potential inhibitor of the TORC1 pathway in S. Cerivisiae to induce a dose dependent autophagic response.
Rosella Plasmid
Rosella is a fluorescent reporter of autophagy which is composed of green and red markers. When autophagy is induced emissions of specific wavelengths can be detected after excitations using a spectrophotometer. By transforming the yeast with a Rosella plasmid, this method can be used to detect induced autophagy. 10µL of the Plasmid required for the transformation was obtained from the Dohlman Laboratory at UNC Chapel Hill in an Eppendorf.
Materials and Methods
S. cerevisiae Strain
The WB BY4741 strain of S. cerevisiae was obtained from Dohlman Laboratory at UNC Chapel Hill with the following selection: his3D1 leu2D0 ura3D0 met15D0 LYS2. All the strains were maintained at 30° C in an incubator on the YPD plates upon which they were shipped and were periodically used to inoculate dispersions.
Plasmid Transformation
To transform the yeast, 10mL of all buffers were formulated according to the following recipes:
Resuspension Buffer
- 1 mL 10X TE pH 8.0
- 1 mL 1M LiAc
- 8 mL Use HCl as needed for pH
10XTE
- 100 mM Tris-Cl pH 8.0
- 10 mM EDTA pH 8.0
Use HCl as needed for pH
Transformation Buffer
- 100 µL 10X TE
- 100 µL 1M LiAc
- 800 µL 50% PEG3350
50% PEG3350
- Dissolve 50g PEG3350 into 30ml
- Warm and stir
- Bring volume to 100mL
All solutions were immediately autoclaved or filter sterilized.
Under sterile conditions, 5mL of Luria Broth (LB) was inoculated using a sterile inoculating loop from the WB BY4741 plate. This dispersion was placed in a shaking incubator at 30°C until saturation. This dispersion was then added to 50mL of LB and incubated at 30°C until the was in the range of 0.8-1.2. After vortexing to ensure a homogenous solution, 45mL of the dispersion was separated in three 15mL centrifuge tubes. The yeast was then pelletized in a centrifuge at 3000 RPM for 5 mins before being washed in 15mL water (LB was siphoned off). This washing process was repeated and resulted in a 15mL dispersion. This yeast was then pelletized again and 1mL of Resuspension buffer was added after siphoning off the excess . The 1mL dispersion was transferred to an Eppendorf and vortexed to ensure homogeneity. The solution was then washed with 1mL of Resuspension Buffer after being pelletized at 18000 RPM for 30 seconds. To obtain an optimal number of yeast cells, the concentration of the solution was determined by counting 10µL of cells in a hemocytometer microscope slide. Using the concentration, the volume of the dispersion required to obtain 1-2 x 10⁷ yeast cells was determined.
5mL of Salmon Sperm was submerged in a hot water bath at 90°C for 5 minutes to denature before being cooled in an ice water bath until room temperature was reached. To the Eppendorf containing 10µL of the Rosella plasmid, 50µL of denatured Salmon Sperm, the determined volume of competent yeast cells dispersion, and 600µL of Transformation Buffer were added. After gently vortexing this solution to mix, it was incubated at 30°C for 30 minutes, then at 42°C for 20 minutes. Finally, this solution was washed twice with 1mL of after centrifugation for 30 seconds at 2500 RPM before a final volume of 200µL of was added. This solution of transformed S. cerevisiae was streaked onto SC-LEU-ampicillin plates to ensure strain selection.
Cytotoxicity Assay
To prepare the 4 concentrations of GO in LB used to test the cytotoxic effect of GO on S. cerevisiae, 6mg of GO flakes was added into 30mL of sterile LB. This dispersion was then sonicated for 3 hours. While vortexing, the 1.25mL wells were each filled with the 200µg/L broth. Then 22.5 mL of sterile LB was added to the solution, causing the concentration of GO to halve to 100µg/L. After the next 6 wells were filled with dispersion, 37.5 mL of sterile LB was added to bring the concentration down to 50µg/L. After the next 6 wells were filled with dispersion, 67.5 mL of sterile LB was added to bring the concentration down to 25 µg/L. This concentration was used to fill the next column of 6 wells. Finally, plain LB was added to two columns as the control group (0µg/L) and the blank. Then, all the wells were inoculated with yeast except the blank column using a sterile inoculation loop. The plate was then placed for 72 hours in an incubating multimode microplate reader at 30°C with orbital shaking at 200 rpm. Optical density at 600 nm was measured automatically in five minute intervals.
Fluorescence Marking Assay
To prepare the two concentrations of GO in LB solutions, 50µg/L and 100µg/L, 25mg of GO flakes was added to 250mL of LB. This solution was sonicated for 5 hours in 30 minute intervals. After each interval, the solution was vortexed. Finally, the resultant dispersion was autoclaved. The 250mL dispersion was then split into two 125mL dispersions with the concentration of each being 100µg/mL. One of the dispersions was then added to 125mL of LB to reduce the concentration to 50µg/mL.
Into a 96 well black plate, 48 wells were filled with 200µL of the 100µg/mL GO-LB dispersion, while the remaining 48 wells were filled with 200µL of the 50µg/mL GO-LB dispersion. Finally, each well was individually inoculated with the transformed yeast and the plate was incubated for 24 hours at 30°C to initiate autophagic processes. The plate was then measured at 485/20 nm excitation and 528/20 nm emission with a resultant fluorescence reading for each well.
Data/Results
Cytotoxicity Assay
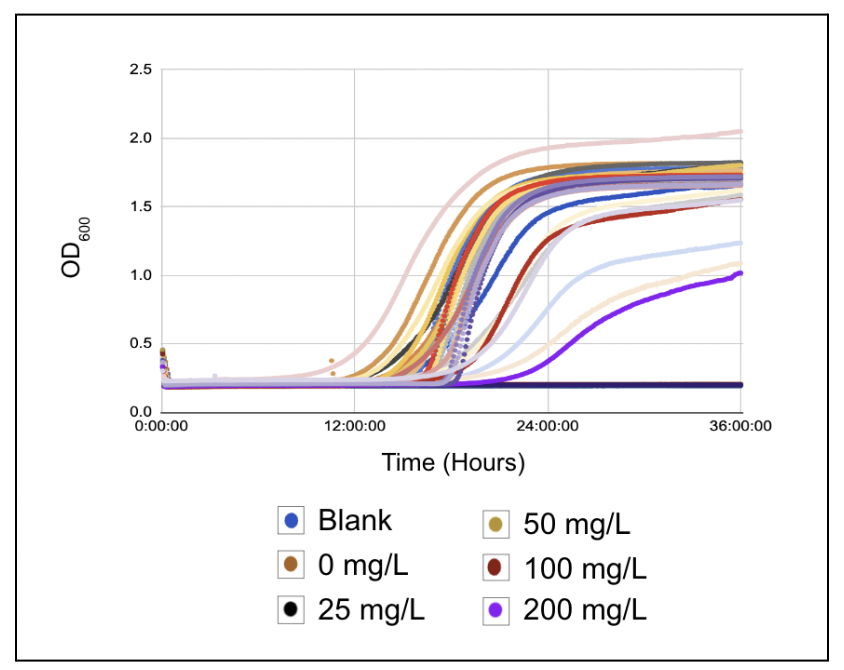
To determine if GO inhibits the regular growth and cell proliferation rates of S. cerevisiae, the yeast was grown in a growth medium which contained determined concentrations of GO. The Optical Density at 600 nm () determines the level of yeast proliferation in the well with higher signifying more proliferation.

Figure 3:Dose dependent growth curve: The Optical Density of each well at 600 nm was measured every 5 minutes and plotted over time resulting in a logistic growth curve showing the proliferation of S. cerevisiae in all inoculated wells.
Figure 3 displays a clear logistic growth curve for the S. cerevisiae grown in all concentrations. There is a clear lag, logarithmic, and stationary phase regardless of concentration. In addition, the of the non-inoculated blank group remained at 0 which confirms the absence of any contamination. There was no significant difference in the rate or intensity of S. cerevisiae cell proliferation/growth when grown in different concentrations of GO.
Fluorescence Marking Assay
Once it was determined that there were no cytotoxic effects of GO on S. cerevisiae growth, GO was applied in the growth medium of the transformed S. cerevisiae to determine its effectiveness in inducing autophagy. The fluorescent readings at 485/20 nm excitation and 528/20 nm emission illustrate the ubiquity of autophagy induction in the samples.

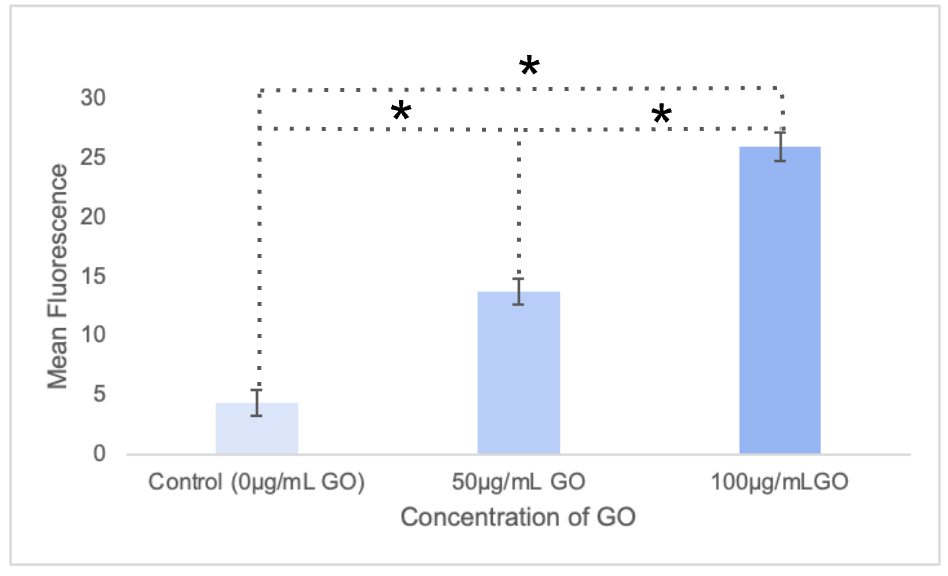
Figure 4:Fluorescent analysis of dose dependent autophagy induction: The fluorescence emission at 528/20 nm was recorded for 32 wells for each group including the control. The average of these values were plotted.
Figure 4 displays a significant dose dependent trend of fluorescence increasing with higher GO concentrations. A mean fluorescence reading of 4.38 was recorded for the control group; the 50µg/mL GO group had a mean fluorescence reading of 13.8; finally, the 100µg/mL GO group recorded a mean fluorescence reading of 26.0.
Discussion and Limitations
Cytotoxicity of Graphene Oxide to S. cerevisiae
Figure 3 demonstrates that GO does not have a significant cytotoxic effect on the cell proliferation of S. cerevisiae. The of each well, regardless of GO concentration, traced the standard logistic curve of S. cerevisiae growth. Furthermore, the curves representing the 0 mg/L, 25 mg/L, 50 mg/L, 100 mg/L, and 200 mg/L groups all overlapped throughout the 36 hours without significant variances, showing the same proliferation rate regardless of concentration. Therefore, higher GO concentrations did not have cytotoxic effects on S. cerevisiae. Because GO is not cytotoxic to S. cerevisiae, it can be tested as an autophagy inducer in S. cerevisiae.
Autophagic Response of S. cerevisiae to Graphene Oxide
Figure 4 demonstrates a dose-dependent effect of GO on autophagic rate of S. cerevisiae in the wells. When comparing either group which included GO, 50µg/mL or 100µg/mL, to the control group with no GO, there was a significant difference in the mean fluorescence reading. With both of these groups with GO compared to the control, there was significantly higher mean fluorescence indicating significantly higher autophagic activity. In other words, the presence of GO inhibited the TORC1 pathway and activated autophagy in the S. cerevisiae.
This effect also appears to be dose-dependent as greater concentrations of GO resulted in significantly higher rates of autophagy. This is shown in the significant difference in mean fluorescence between the 50µg/mL group and the 100µg/mL group. This dose dependence indicates that more quantity of GO is more effective in inhibiting the TORC1 pathway in S. cerevisiae and inducing autophagy.
The induction of autophagy at a dose dependent rate also incites a greater potential for amyloid beta plaques to be broken down with higher concentrations of GO.
Limitations
The scope of this study focused on inducing autophagy in S. cerevisiae, not directly on amyloid beta plaques. Therefore, though suggestions that amyloid beta plaques could be broken down at greater rates in the presence of GO due to autophagy can justifiably be made, more research is necessary for conclusive results.
Furthermore, cytotoxicity of GO to S. cerevisiae was determined for the chosen concentrations, however, higher/lower concentrations should be tested to determine the viable range for GO.
Another limitation is that the transformation of the yeast with the Rosella plasmid occurred over the course of three work days. Overnight, certain mixtures of ingredients from the middle of the protocol were left sitting which could have affected the quality of the produced S. cerevisiae strain.
Conclusions and Future Work
The results from the cytotoxicity assay and the fluorescent indicator assay support that Graphene Oxide is a viable candidate to break down amyloid beta plaques. The initial cytotoxicity assay validated the results by providing evidence that GO was not cytotoxic to the S. cerevisiae and did not inhibit cell proliferation. By transforming the S. cerevisiae to include a fluorescent indicator of autophagy, the process by which amyloid beta plaques can be broken down, the inhibitory effects of GO on the TORC1 pathway which regulates autophagy became clear. The data strongly supports that autophagy is not only induced by the presence of GO, but also that greater concentrations of GO result in a dose dependent increase in autophagic response.
The next step is to determine the effects of GO directly on amyloid beta plaques in model organisms such as Caenorhabditis elegans or Drosophila melanogaster which can directly model said plaques. Moreover, the effects of a continuous reintroduction of GO into the growth medium could provide insight into the inhibition of the TORC1 pathway. Finally, Western Blot or ELISA assays which can test the presence and concentration of autophagy-related proteins (ATG 13) could further confirm the induction of autophagy.
I would like to sincerely thank Mr. James Happer and Mrs. Jennifer Williams for providing me with the opportunity as well as constant guidance and feedback throughout my research journey. Their unwavering support and mentorship has been invaluable in overcoming the obstacles and roadblocks. I would also like to sincerely thank Dr. Henrik Dohlman and Mr. Dalton Taylor of the Department of Pharmacology - Dohlman Laboratory at the University of North Carolina Chapel Hill for providing me with the strain of yeast and the Rosella plasmid as well as guidance and support. I would also like to thank the North Carolina School of Science and Mathematics which provided me with the opportunity to conduct a research project as a part of the Research in Science program. Finally, thank you to Carolina Biological Supply and Thermo Fisher for supplies.
Copyright © 2024 Jonnavithula. This is an open-access article distributed under the terms of the Creative Commons Attribution 4.0 International license, which enables reusers to distribute, remix, adapt, and build upon the material in any medium or format, so long as attribution is given to the creator.
- AD
- Alzheimer's Disease
- GO
- Graphene Oxide
- LB
- Luria Broth
- mTOR
- Mammalian Target of Rapamycin
- mTORC1
- Mammalian Target of Rapamycin Complex 1
- WHO
- World Health Organization
- of Aging, N. I. (2021). What Is Alzheimer’s Disease? https://www.nia.nih.gov/health/alzheimers-and-dementia/what-alzheimers-disease
- (2022). Alzheimer’s & Dementia, 18(4), 700–789. 10.1002/alz.12638
- of Canada, A. S. (n.d.). How Alzheimer’s disease changes the brain. https://alzheimer.ca/en/about-dementia/what-alzheimers-disease/how-alzheimers-disease-changes-brain
- Organization, W. H. (2023). Dementia. https://www.who.int/news-room/fact-sheets/detail/dementia
- Zou, Z., Tao, T., Li, H., & Zhu, X. (2020). mTOR signaling pathway and mTOR inhibitors in cancer: progress and challenges. Cell & Bioscience, 10(1). 10.1186/s13578-020-00396-1
- Uddin, Md. S., Stachowiak, A., Mamun, A. A., Tzvetkov, N. T., Takeda, S., Atanasov, A. G., Bergantin, L. B., Abdel-Daim, M. M., & Stankiewicz, A. M. (2018). Autophagy and Alzheimer’s Disease: From Molecular Mechanisms to Therapeutic Implications. Frontiers in Aging Neuroscience, 10. 10.3389/fnagi.2018.00004
- Li, X., Li, K., Chu, F., Huang, J., & Yang, Z. (2020). Graphene oxide enhances β-amyloid clearance by inducing autophagy of microglia and neurons. Chemico-Biological Interactions, 325, 109126. 10.1016/j.cbi.2020.109126
- Inoue, Y., & Nomura, W. (2018). TOR Signaling in Budding Yeast. In The Yeast Role in Medical Applications. InTech. 10.5772/intechopen.70784
- Rangarajan, N., Kapoor, I., Li, S., Drossopoulos, P., White, K. K., Madden, V. J., & Dohlman, H. G. (2020). Potassium starvation induces autophagy in yeast. Journal of Biological Chemistry, 295(41), 14189–14202. 10.1074/jbc.ra120.014687
- Jiříčková, A., Jankovský, O., Sofer, Z., & Sedmidubský, D. (2022). Synthesis and Applications of Graphene Oxide. Materials, 15(3), 920. 10.3390/ma15030920
- Trusek, A., Kijak, E., & Granicka, L. (2020). Graphene oxide as a potential drug carrier – Chemical carrier activation, drug attachment and its enzymatic controlled release. Materials Science and Engineering: C, 116, 111240. 10.1016/j.msec.2020.111240
